
Fertilizer Management: Current Challenges
[addw2p name=”fertilizerMgmt”]
Some current challenges and future trend
The fertilizer management system described thus far can be regarded as traditional method commonly adopted in the oil palm plantations. It has served the industry well as evidenced by the high FFB yields, respectable returns to manuring and sustainability. But, the industry now faces many new challenges and some of them are briefly discussed below.
Labour requirements
The current plantation management system is labour intensive and many of them are deployed in manuring work. Switching to mechanical spreading of fertilizers will immediately result in tremendous saving in labour requirements but the following principal points should be noted (Chew et al ., 1994a):
• Application efficiency increases when roots system of oil palms are adequately developed and spread out
• Avoid application over eroded and compacted areas traversed by in-field vehicles which suffer severe run-off
• Limited to areas of suitable terrain and soil types which can take vehicle load
Apart from the above points to consider, there is usually a lack of control in actual fertilizer application rate with mechanical spreader since the speed of tractor is variable and the actual traverse path of the tractor is determined by the driver. Both difficulties can probably be overcome with electronic controller and GPS.
Other responses to the high labour requirements for manuring are to reduce the frequency of application to once a year e.g. the use of FELDA or AA+ Mulch TM for mature palms (Figure 1), effective sources of fertilizers, improving nutrient holding capacity of the soils and better nutrient uptake by roots. Recent results showed that applying fertilizers under the FELDA Mulch resulted in better leaf and rachis P and K concentrations of oil palms compared with broadcasting in a high rainfall region in Sarawak (Figure 2). This system reduces surface run-off and erosion of applied nutrients and avoids excessive concentration of applied nutrients at a spot. Therefore, it allows the application of fertilizers during wet weather. This method also provides better flexibility in the manuring programme and utilization of labour. However, the long-term economic returns from this system are still being evaluated.
Figure 1: Experimental testing of FELDA mulch for mature palms to reduce the frequency of fertilizer application and surface run-off losses of nutrients.

Source: Lee et al . (2008)
Figure 2: Effects of methods of fertilizer application using FELDA Mulch (FM) and broadcasting (FSP) on leaf and rachis nutrient concentrations of oil palms. Trial was layout in a high rainfall region in Lundu, Sarawak (FASSB, unpublished)

Fertilizer prices
The volatile fertilizer prices in the past two years have been described as a “perfect storm” in IFDC report, Volume 33(4), December 2008. According to the report, numerous factors converged simultaneous to cause fertilizer prices to soar and then suddenly collapse. The latter was attributed to “demand destruction” when farmers were unable or unwilling to pay two to three times the prices of early 2007. The report further stated that the situation worsened with the collapse of the global credit market, a trade recession and slowdown in world economic growth. This depressing scenario of the fertilizer market for at least the next two years is nothing new as it has happened on a number of occasions in the past although the factors causing them might vary.
The first reaction of most farmers and planters to high fertilizer prices is generally to withdraw fertilizer inputs for better cash flow. However, as advised by Dr. Ng Siew Kee in the 1970s, we should look inwards first and examine various scopes to improve fertilizer use efficiency for greater economy in fertilizer usage. This would include adapting the various methods to fully utilize the by-products in the mill on a large scale in a practical manner as another source of soil amendments and fertilizers and not fertilizer substitutes or waste products. Thus, their agronomic and economic values must be painstakingly computed as shown in Goh et al . (1999). Any potential wastage in the fertilizer management system such as luxurious fertilizer regimes for the sites, poor fertilizer quality and incorrect timing of fertilizer application must be strictly attended to immediately.
The next step is to be fully aware of the factors affecting the economics of fertilizer usage as provided by Hew et al . (1973) and Lo and Goh (1977). Some of the major factors in the computation are the base yield, fertilizer response, discount factor, prices of palm oil and fertilizers, and agricultural risk. These factors are site dependent i.e. soils, palm age, climate and their interaction with nutrients and thus, it should be the agronomist who determines the quantum and where fertilizer should be reduced to meet the company’s cash flow and anticipated profit. Ng and Goh (2003) also showed that the type of agricultural risk to be taken depends on the economic situation and cash flow of the company. Under tight cash flow or low profitability, risk preference approach is probably the best option.
In determining the fertilizer response curve, the agronomist should calculate the impact of both fertilizer withdrawal and subsequent re-application of fertilizer. An example is illustrated in the self-explanatory Figure 3 where seasonal trend has been removed.
Figure 3: Predicted effects of fertilizer withdrawal and resumption on FFB yields in Malaysia using AAR’s combinatorial model. Source: AAR (Unpublished)

The main features to note in this graph are:
• The decline in yield depends on palm nutritional status, soil fertility and time
• There is a time lapse of about a year before a linear decline in yield is observed
• The minimum yield depends on soil fertility and palm age
• The recovery rate depends on palm nutritional status
• When the palm is severely malnourished, its maximum yield is about 10% below its potential even after full recovery (Warriar and Piggott, 1973; Caliman et al. , 1994). The reason for this is still uncertain.
Reducing fertilizers or totally withdrawing them for economic reasons should always be a last resort because some yield loss will ultimately happen and the economic optimum is usually not achieved. However, it will relieve the cash flow problem of the company because fertilizer cost is the largest operational cost in managing an oil palm plantation. Thus, if fertilizer withdrawal is absolutely necessary, the following strategy might be followed but it certainly require a competent agronomist to implement it correctly:
• Select the nutrient with the least impact on FFB yield (revenue depends on prices and thus difficult to target)
• Any cheaper sources?
• Select soil types/fertility with lowest FFB yield response to the nutrient
• Select the climatic zone with least impact on FFB yield
• Select palm age category with least impact on FFB yield
• Go to step (a) until objective is achieved
This strategy will choose the category of palms for fertilizer withdrawal and the nutrients and quantity to be withdrawn that will result in the least impact on FFB yield allowing quicker recovery when the economic situation improves. It is also site-specific. Thus, it is superior to the usual strategy of many companies to cut fertilizers by a certain margin across the board, which may lead to drastic yield decline in areas with good fertilizer responses.
Sources of fertilizers
In 2007, urea accounted for more than 50 % of the world N production (excluding ammonia). This is also true in Malaysia where urea and urea-based fertilizers will take the lion share of the N market although in the oil palm industry, the converse may be true. The latter was due to the unpredictable N volatilization losses on inland soils which deter most agronomists from recommending it widely. If the N volatilization losses can be controlled to a predictable, narrow range for each environment, then it is possible to use urea as a main source of N for oil palm on inland soils whenever it is cost effective.
Currently, many methods are available to reduce N volatilization losses from urea such as urease inhibitors, S-coating (perhaps using 10% S only since Malaysian soils are generally acidic), humic acid, K and B. Also, slow release fertilizers and bio-fertilizers which are urea based are being marketed in Malaysia. We should conduct proper, well replicated trials to evaluate their effectiveness for oil palm on inland soils. Another way to stop or minimize N volatilization from urea is to apply it under AA+ Mulch TM or FELDA Mulch.
There is also a growing interest in bio-fertilizers because of the premise that the soils under oil palm are relatively sterile due to long-term fertilizer usage, and the effective microorganisms (EM) in bio-fertilizers can rejuvenate the soils leading to improve soil fertility and subsequent better productivity. Microbes are the unseen majority in soils but despite their abundance, the impact of soil microbes on ecosystem processes is still poorly understood (van der Heijden et al ., 2008). The latter workers, in their extensive review, concluded that soil microbes must be considered as important drivers of plant diversity and productivity in terrestrial ecosystems. Despite this enthusiasm, there has been no conclusive evidence that introduced EM improve crop productivity in the fields. Similarly, Blal (1989) working on the effectiveness of vesicular-arbuscular endomycorrhizas on oil palm showed that it was only effective on sterile soils. Nevertheless, this new area of research should be explored albeit at a lower level to provide data on the best route to take.
Fertilizer quality
Fertilizer quality has always been a concern to the industry. Although we have SIRIM standards, they were drawn up at a time when fertilizer prices were relatively low. With the current high fertilizer prices and the improvement in laboratory techniques and fertilizer manufacturing technology, it is perhaps logical or even warranted to call for a review of the standards particularly those related to compound fertilizers and fertilizer mixture. Also, newer experimental data are now available to assess the effectiveness of various fertilizers such as rock phosphate (Chan and Goh, 1997a, Zin et al ., 2001) which should be incorporated into the standards.
RSPO
The creation of RSPO has added another dimension to the many aspects of an agronomist’s roles because fertilizer management is part of the Principles and Criteria of sustainable palm oil under Principle 4.2. This Principle states that soil fertility should be maintained or improved to a level that ensures optimal and sustained yield by monitoring the trend of soil organic matter and net fertilizer inputs. As expounded earlier, this has always been a feature in the conventional fertilizer management system of oil palm.
Ng et al . (2004) showed that soil organic C decreased with time in the oil palm plantation during the period when the oil palm biomass was allowed to be burnt or partially burnt at replanting. However, large increases in soil organic C occurred with the current zero burnt replanting technique in the first few years. This positive change has not been traced over the life cycle of oil palm and moreover, there is currently no conclusive evidence to show that the improved soil organic C will lead to better or sustained productivity/yield of oil palm to the best of our knowledge. This provides a golden opportunity for researchers to undertake the study in order to understand the mechanism and impact of this important subject matter.
Chew et al . (1994a), Kee et al . (1995) and Ng et al . (2004) demonstrated that soil pH will decline at localised area in the oil palm agro-ecosystem such as the palm circle due to the use of acidifying N fertilizer. However, it does not appear to affect the productivity of oil palm. There is also a strong build-up of soil P and K especially in the palm circle in order to maintain adequate solution P and K for optimal uptake of these nutrients by the palms. We need to develop some methods to improve the uptake of these nutrients in the palm circles by the palms perhaps by increasing soil organic matter and/or soil pH or through soil microbes.
Chew et al. (1994a) in their review clearly showed that leaching losses of nutrients under oil palm were relatively low. This was supported by Foong (1993), Omoti et al . (1983), Schroth et al . (2000) and recent unpublished work at AAR where the latter showed non-significant difference in solution nitrate concentrations between the optimal N rate and without N input at 120 cm depth after 18 years of differential fertilizer treatments (Figure 4).
Figure 4: Leaching losses of nitrate under oil palm on an ultisol after 16 years of differential N inputs. Source: AAR (Unpublished)

Chew et al. (1994a) and Kee and Chew (1996) also showed that the off-site effect of applied nutrients, which are mainly in the forms of run-off and erosion, were generally low at less than 15% if they were applied during suitable months for fertilizer application. The major concern here is the lack of data to assess the impact of these processes in hilly areas on the environment and fertilizer use efficiency. Nevertheless, Chew et al.(1994a) concluded that the major risks to the environment arise from the following:
• At times of clearing for oil palm planting with the large release of soluble nutrients especially K from old stand of oil palm
• Over-application of fertilizer to young palms before full development of the root system or full growth when leaching losses are highest. Split fertilizer applications are very important at this stage to improve nutrient uptake efficiency.
These two aspects of oil palm cultivation are currently subjects of active research in Malaysia.
Of interest to many researchers now is the maintenance or improvement of soil quality. In fact, in highly weathered and degraded soils of the tropics, the latter is more important to sustain high yield and profitability. However, the definition of soil quality is still subject to much debate. Nevertheless, RSPO indirectly stated that soil quality includes structure, organic matter content, nutrient status and microbiological health of the soil. While the definition of soil quality may not be the most important to our industry, we should still establish quickly some practical agro-biological indicators of the soils that have significance on the fertilizer management and sustained productivity.
Climate change and variability
Climate change and its variability have existed since time immemorial. A large proportion of these changes is natural and involves geophysical processes. However, the main concern now is the rapid rate of climate change globally that is detected recently and generally attributed to anthropogenic causes. The evidences for the latter thus far especially in the long-term have been scientifically weak. In fertilizer management of oil palm, our main concerns are the impact of fertilizer use on
• greenhouse gas (GHG) emission
• soil C build-up
• energy use
In GHG emission, it is probably only relevant in “wet” soils where the risk of anaerobic conditions is higher with consequent methane and nitrous oxide emissions. Melling et al. (2006) showed that the application of urea to oil palm on deep tropical peat only resulted in a short-term emission of small amount of methane in the month of application (Figure 5).
Figure 5: Monthly CH4 flux before and after urea application at the oil palm plantation. Data represent mean ± standard error (n = 3)

Source: Melling et al. (2006)
The effect disappeared two months after urea application. This short term effect was ascribed to reduced oxidation of methane due to its inhibition by NH 4 + ion which was produced when urea hydrolysed. Urea application to deep tropical peat under oil palm has no significant effect on nitrous oxide emission (Melling et al. , 2007). Although these results showed that urea has little or no role on GHG emission from tropical peat under oil palm, further work is necessary for a firm conclusion to be made.
Fertilization has been shown to enhance the productivity of oil palm with consequent better rooting system of more than 12 t dry matter per ha. However, the sequestration of this organic matter to soil organic C in different environments is still uncertain. There is also a lack of data on C sequestration from the various sources of organic matter produced by the oil palm e.g. pruned fronds, EFB, POME and decanter cake, and the leguminous cover crops. This information has a large bearing on the C cycle of oil palm and its impact on climate change.
The energy balance of oil palm has been estimated by a few workers such as Wood and Corley (1993), Reijnders and Huijbregts (2008) and Wickeet al . (2008). However, they generally did not include the latest technology of fertilizer production which is more energy efficient (de Vries, 2008), the increasing use of locally manufactured urea based fertilizer and recycling of oil palm biomass residues and mill by-products and thus, probably grossly over-estimated the energy use in oil palm plantation. It is critical that a new life cycle analysis (LCA) of the energy balance of oil palm be made in view of the pressing need to correctly inform our buyers, consumers and NGOs with scientifically based data.
Competent agronomists
The current and future crop of agronomists has a formidable task not only to improve fertilizer use efficiency and palm oil yield but also meet the many challenges listed above and future work below. Thus, they must have the leadership and creativity to meet these challenges and the courage and commitment to pursue and persevere towards their convictions and maintain the highest standards possible. The ability to adapt to change and avoid self ego is essential if we are to maintain our edge over the competing vegetable oil crops in the long run. Also, the agronomists are now regularly requested to evaluate untested products for the plantations. They must maintain their integrity and based their decisions on scientific ground and guiding principles of soil and plant nutrition, and do not allow friendship and emotion to cloud their judgement. The other roles of agronomists were well described by Chan and Goh (1997b) and Chew and Goh (2003). The cooperation between agronomists from different organisations should continue to be fostered and joint research work initiated to solve problems of common interest. With the rapid expansion of oil palm worldwide, the number of agronomists required has also increased correspondingly and the lack of competent agronomists is becoming apparent. The industry will do well to provide the necessary atmosphere, coercion, training, facility and remuneration to attract the best and ensure that this unenviable task is under good hands.
Reference:
GOH, K.J., G, P.H.C. AND LEE, C.T.: Fertilizer Management and Productivity of Oil Palm in Malaysia
The full list of references quoted in this article is available from the above paper.
Fertilizer Management: Future Works and Research
[addw2p name=”fertilizerMgmt”]
The future work in oil palm agronomy has been well discussed by Soh et al . (2006), Kee and Goh (2006), Goh (2005), Chew and Goh (2003), Kee et al . (2003) and Chew et al . (1997) just to name a few from AAR only amongst the many from other organisations in the oil palm industry over the years. It is neither our duty nor the place here to summarize these papers but to complement them.
The principles and philosophy of nutrient budget have served us well as evidenced by the high productivity of oil palm despite being largely grown on weathered, degraded soils in the tropics. Currently, the oil palm has probably the best nutrient use efficiency per tonne of vegetable oil. While the K budget can account for the optimal K rates in fertilizer response experiments, the N budget cannot explain over 30% of the N balance (Table 1) in the same set of experiments. This will require the more difficult research work on nutrient cycling and dynamics, which should yield results for further improvement of fertilizer use efficiency of oil palm. This work should include other minor nutrients and elements known to affect crop performances.
Table 1: Nutrient balance computations for commercial areas. Source: Chew et al . (1994b)
|
Commercial areas |
Soil series |
% N balance |
% K balance |
|
1 |
Tavy |
-32.5 |
+1.0 |
|
2 |
Munchong |
-38.6 |
-6.7 |
|
3 |
Tavy/Gajah Mati |
-27.8 |
+8.3 |
|
4 |
Prang/Local Alluvium |
-39.1 |
-0.3 |
|
5 |
Munchong/Tavy |
-36.3 |
-1.9 |
|
6 |
Bungor/Batu Lapan |
-30.7 |
+1.0 |
|
7 |
Munchong/Rasau |
-35.8 |
+4.5 |
|
8 |
Munchong/Holyrood |
-37.1 |
-0.9 |
|
9 |
Munchong |
-32.7 |
+14.2 |
The roles of biotic factors on palm nutrition are expected to become more prominent as we breed for truer inbred hybrids with more uniform (identical) genetic make-up on a commercial scale. Similarly, the greater use of clones and re-clones will necessitate the study of their specific or differential nutrient requirements. For example, in Clone 1, there was hardly any response to K fertilizer inputs after years of experimentation compared with Clone 2 and DxP materials (Figure 16). Similar results have been reported by Jacquemard et al . (2002) and Donough et al . (1996). Another black box in oil palm nutrition is the roles of soil microbes and biodiversity. This needs urgent studies if we are to exploit this largely unknown soil resource.
Figure 1: Differential FFB yield responses of oil palms propagated by tissue culture (clonal) and seeds (DxP) to K fertilizer in Kumansi Family soil in Sabah, Malaysia. Average yields between 2003 and 2008 were shown in the graph. Source: AAR (Unpublished)
The lack of study on physiological plant nutrition in the oil palm industry is still glaring. This deficiency must be addressed quickly to understand the various phenomena seen in the fields such as pre-mature frond desiccation, relationship between pest and diseases and palm nutrition, the root system and its mechanism for nutrient uptake, and the roles of plant nutrition in climate change amongst others; and develop new direction for studying plant nutrition and better, practical fertilizer use technology.
In the seventies and early eighties, there was much co-operation among the research organisations in Malaysia for joint research on common problems and meta-analysis of experimental data. For example, the combined analysis of fertilizer response trials from the industry by Dr. Foster and co-workers has resulted in a fertilizer recommendation system for oil palm and a set of indicators of palm health (Goh, 2005). However, newer agronomic data are now available and these experiments are conducted with later generation of planting materials and current recommended management practices on more diverse soil types and environments, which are probably more relevant to the industry today. Thus, it appears logical to conduct another meta-analysis of these newer data.
The palm oil mills should be regarded as large stores or reservoirs of nutrients/fertilizers and carbon/organic matter. The current methods to utilize these resources are still tedious, laborious, cumbersome and limited to specific areas. Furthermore, the expensive soluble nutrients such as K are probably not fully recovered. Theoretically, if all the nutrients can be recovered, the oil palm industry needs very little fertilizers because our main produce, palm oil, does not contain much nutrients. While we are not suggesting turning the palm oil mill into fertilizer factory, scrutinizing for new technology to recover these nutrients and carbon and making them user friendly e.g. granulation or liquid fertilizers are urgently needed. In fact, a growing number of agronomists worldwide has the opinion that producing higher yields requires not only advanced genetics but good agronomic management which includes good plant nutrition utilizing both organic and inorganic nutrient sources (Roberts, 2009). Apart from the above impact, it will have huge implications on carbon credit, carbon balance, energy balance, sustainability and a host of other initiatives related to global palm oil trade.
Research Work
Research work on precision agriculture in oil palm has commenced in the 1990s and its potential applications have been demonstrated (Goh et al. , 2000). For example, the generation and combination of yield maps of plots with and without nitrogen application in a classical fertilizer response trial (about 25 ha) using geostatistical methods showed strong spatial yield responses to nitrogen (Figure 2). They ranged from good FFB yield response of more than 50 kg/palm/yr or 6.6 t/ha/yr in the central portion of the field to poor or negative yield responses in the eastern and western parts. This information can be transformed into management zone for site-specific management (Anuar et al ., 2008). Further work is needed to exploit this technology for improved effectiveness and efficiency of inputs leading to better productivity and profitability.
Figure 2: Spatial FFB yield response of oil palms on Kumansi Family soil to N fertilizers
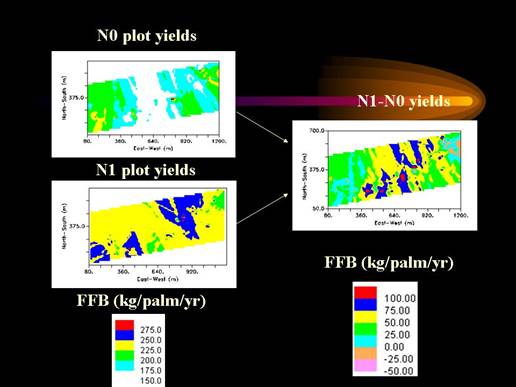
Source: Goh et al . (2000)
The oil palm environments comprise numerous elements or growing conditions where their interplays have a strong impact on the yield response to fertilizer inputs. For example, Kee and Chew (1993) demonstrated that the N rate may be reduced by half under irrigated compared with non-irrigated oil palm in an area with monsoonal climate (Figure 4). This was attributed to better nutrient uptake under adequate soil water throughout the year ensuring optimal palm nutritional status at most times with consequent fuller expression of FFB yields. Similarly, FELDA Agricultural Services Sdn Bhd. (FASSB) clearly showed that the FFB yields of oil palm under irrigated condition in a dry region were consistently higher (35% or 45 t/ha over five years) than non-irrigated condition given the same fertilizer regime (Figure 3). These results indicate that we may need a series of multi-factorial trials to decipher and understand the role of each growing condition on fertilizer response and to provide the recommended set to the planters to implement for best results. In fact, it is of utmost importance that the agronomists identify these conditions and design farming system that optimises the fertilizer use efficiency.
Figure 3: Effect of irrigation on N response of oil palm in a wet monsoonal climate in Malaysia
Source: Kee and Chew (1993)
Figure 4: Effect of fertilizer (N1P1K1) on oil palm yields in a dry region under irrigated and non-irrigated (FASSB, unpublished)
Technology, techniques and equipment are now available and there are hardly any reasons why these studies cannot be undertaken successfully. What is needed is creativity and ingenuity to solve our problems. As published by The Sunday Star, the local newspaper on 5 th April 2009, “Science triumphs common sense when it really matters”. Thus, the future of effective fertilizers, fertilizer use efficiency and fertilizer management, and the consequent productivity of oil palm reside in continuous generation of new applicable sciences, adaption of new technologies and designing new methods to implement them correctly and efficiently, and reducing the uncertainties related to fertilizer management.
Reference:
GOH, K.J., G, P.H.C. AND LEE, C.T.: Fertilizer Management and Productivity of Oil Palm in Malaysia
The full list of references quoted in this article is available from the above paper.
Fertilizer Management: Fertilizer Efficiency
[addw2p name=”fertilizerMgmt”]
MAXIMIZING FERTILIZER USE EFFICIENCY
I Assessment of nutrient use efficiency
Three basic questions must be answered in all assessments of fertilizer use efficiency:
- How much of the nutrients applied are taken up by the crop?
- How much additional yield is obtained for each additional unit of nutrient uptake?
- To what extent can the crop benefit from the nutrients not recovered by the crop during the period of assessment?
There are five indices that can be used to assess nutrient use efficiency.
Partial factor productivity (PFP)
PFP answers the question: How much yield is produced for each kg of fertilizer nutrient (FN) applied?
PFPFN = kg bunch kg-1 fertilizer nutrient (FN) applied:
PFPFN = BY+FN / FN (1)
where BY+FN is the bunch yield (kg ha-1) and FN is the amount of fertilizer nutrient applied (kg ha-1).
Because BY at a given level of FN represents the sum of yield without fertilizer inputs (BY0FN ) plus the increase in yield from applied fertilizer (ΔBY+FN),
PFPFN = (BY0 FN + ΔBY+FN) / FN (2)
or
PFPFN = (BY0 FN / FN) + (ΔBY+FN / FN) (3)
and by substitution with equation (5):
PFPFNFN = (BY0 FN / FN) + AEFN (4)
where AE+FN is the agronomic efficiency of applied fertilizer nutrients (see below).
Equation 4 shows that PFPFN can be increased by increasing the uptake and use of indigenous soil-N resources (measured as BY0FN) and increasing the efficiency of applied fertilizer nutrient use (AEFN).
Agronomic efficiency (AE)
AE answers the question: How much additional yield is produced for each kg of fertilizer nutrient (FN) applied?
AEFN = kg bunch yield increase kg-1 FN applied (often-used synonym: nutrient use efficiency):
AEFN = (BY+FN – BY0 FN) / FN (5)
where BY+FN is the bunch yield in a treatment with fertilizer nutrient application; BY0 FN is the bunch yield in a treatment without fertilizer nutrient (FN) application; and FN is the amount of fertilizer nutrient applied, all in kg ha-1.
AEFN represents the product of the efficiency of nutrient recovery from applied nutrient sources (= recovery efficiency, REFN) and the efficiency with which the plant uses each unit of nutrient acquired (= physiological efficiency, PEFN):
AEFN = PEFN x REFN (6)
Both REFN and PEFN thus contribute to AEFN, and each can be improved by crop and soil management practices, including general crop
management practices and those specific to nutrient management, e.g. a more balanced N:P:K ratio or improved splitting and timing of nutrient applications (see Table 2 and 3).
Because AEFN = PEFN x REFN, it is necessary to quantify the relative contribution of each component to explain measured differences in agronomic efficiency that result from different nutrient or crop management strategies.
Recovery efficiency (RE)
RE answers the question: How much of the nutrient applied was recovered and taken up by the crop?
REFN = kg fertilizer nutrient taken up kg-1 fertilizer nutrient applied:
REFN = (UN+FN – UN0 FN) / FN (7)
where UN+FN is the total palm uptake of fertilizer nutrient measured in aboveground biomass in plots that receive applied fertilizer nutrient at the rate of FN (kg ha-1); and UN0 FN is the total nutrient uptake without the addition of fertilizer nutrient.
REFN is obtained by the ‘nutrient difference’ method based on measured differences in plant nutrient uptake in treatment plots with and without applied nutrient (Equation 7). Recovery efficiency of applied nutrient is estimated more accurately when two treatments with a small
difference in the application rate are compared:
REFN = (UNFN2 – UNFN1) / (FNFN2 – FNFN1) (8)
where REFN is the recovery efficiency (kg nutrient uptake kg-1 nutrient applied); UN is the total nutrient uptake in bunches, fronds and trunk (kg ha-1); and FN is the amount of fertilizer nutrient added (kg ha-1) in two different nutrient treatments (FN2 and FN1) e.g. FN2 receiving a larger nutrient rate than FN1.
REFN is affected by agronomic practises and rainfall (Table 2)
Physiological efficiency (PE)
PE answers the question: How much additional yield do I produce for each additional kg of nutrient uptake?
PEFN = kg bunch yield increase kg-1 fertilizer FN taken up:
PEFN = (BY+FN – BY0 FN) / (UN+FN – UN0 FN) (9)
where BY+FN is the bunch yield in a treatment with fertilizer nutrient (FN) application (kg ha-1); BY0 FN is the bunch yield in a treatment without fertilizer nutrient (FN) application; and UN is the total uptake of fertilizer nutrient (kg ha-1) in the two treatments.
PEFN represents the ability of a plant to transform a given amount of acquired fertilizer nutrient into economic yield (oil or bunches) and largely depends on genotypic characteristics such as the bunch index and internal nutrient use efficiency, which is also affected by general crop and nutrient management (Table 2).
Internal efficiency (IE)
IE answers the question: How much yield is produced per kg fertilizer nutrient (FN) taken up from both fertilizer and indigenous (soil) nutrient sources?
IEFN = kg bunch kg-1 FN taken up:
IEFN = BY / UN (10)
where BY is the bunch yield (kg ha-1), and UN is the total uptake of fertilizer nutrient (kg ha-1).
This definition of IEFN includes FN taken up from indigenous and fertilizer sources. IEFN largely depends on genotype, harvest index, interactions with other nutrients and other factors that affect flowering and bunch formation.
II Implementation of nutrient use efficiency assessment in oil palm fertilizer experiments
In annual crops, destructive sampling methods can be used to measure nutrient uptake in fertilized and unfertilized plots in each crop season and fertilizer nutrient use efficiency can then be calculated by difference (Dobermann and Fairhurst, 2002). The relative ease with which this can be carried out explains why in grain crops, measurement of nutrient use efficiency is standard practice when analyzing data from field fertilizer experiments. Destructive sampling cannot be used in oil palm fertilizer experiments, however, because it is costly and precludes the possibility of further measurements in the experiment. For this reason, Fairhurst (1996) and Fairhurst (1999) devised a nondestructive approach to measure nutrient uptake, based on standard methods for estimating above ground biomass production in trunk, leaf, bunches (Corley et al., 1971, Appendix 6) combined with tissue analysis. Nutrient uptake is calculated from the nutrient concentration and the amount of biomass produced (kg ha-1 yr-1) respectively in the trunk, leaves, and bunches, and nutrient use efficiency is measured by comparing nutrient uptake in different treatments in fertilizer experiments.
Differences in nutrient use efficiency between plantations, blocks, single palms or fertilizer sources are explained by a range of factors (Table 2). The goal of a good field management is to maximize uptake by identifying possible limiting factors and implementing remidial measures.
These methods were used to assess nutrient use efficiency in six fertilizer trials at Bah Lias Research Station (BLRS) (Prabowo et al., 2002). Preliminary results from one year of measurements indicate recovery efficiencies of 19–36% (N), 7–29% (P), 29–70% (K) and 10–60% (Mg) (Table 1). Large differences in RE were measured for different fertilizer sources of P and Mg fertilizer and RE was much greater when these nutrients were supplied in soluble forms respectively as TSP and kieserite (Table 1).

Table 1. Recovery of nutrients from mineral fertilizers in five fertilizer experiments in North
Sumatra, Indonesia (after Prabowo et al., 2002).
In almost all cases, RE was greater for each nutrient when other nutrients were supplied in non-limiting amounts. RE was smaller in Trial 231 where high rainfall resulted in large fertilizer nutrient losses in surface water runoff and eroded soil (Prabowo et al., 2002). In Trial 231 RE was >100% for K where yield was less than 23 t ha-1. This suggests that palms were able to use soil indigenous K more efficiently after K deficiency had been corrected.
The separation of AE into its components of RE and PE provides the means to identify problems in fertilizer response experiments. For example it may be possible to achieve large values for RE but low values for PE result in low values for AE. Field management factors can be separated into those affecting RE and PE (Table 2). For example, RE may be large in a fertilizer treatment but a low value for PE is caused by inter palm competition and the genetic characteristics of the planting material.
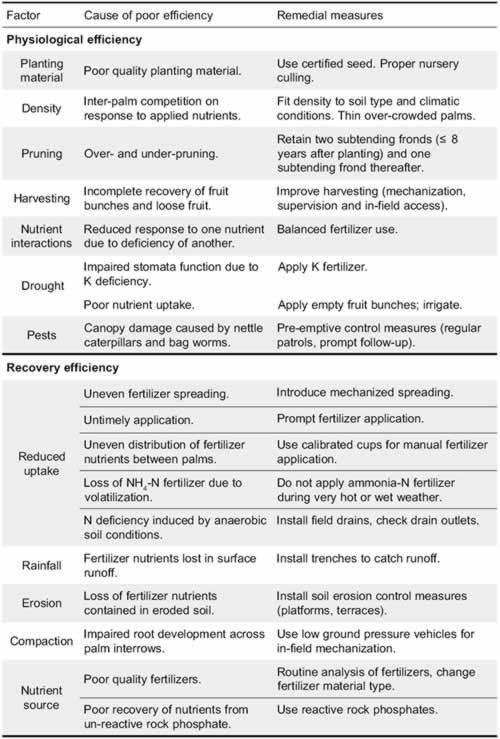
Table 2. Examples of factors affecting and physiological efficiency (PE) and recovery
efficiency (RE) of fertilizer nutrients in oil palm.

Table 3. Effect of fertilizer placement on bunch yield in Malaysia.
Reference
Goh K.J., Rolf Härdter and Thomas F. (2003) Fertilizing for maximum return. In: Thomas Fairhurst and Rolf Hardter (eds). Oil palm: Management for large and sustainable yields. Potash & Phosphate Institute and International Potash Institute: 279-306
Note: The full list of references quoted in this article is available from the above paper.
Fertilizer Management: Computation
[addw2p name=”fertilizerMgmt”]
Nutrient balance approach
The methods to estimate the fertilizer rates, which have been described so far, are all empirical and therefore, should be used within the same environments where they have been developed. This limitation is partially overcome by methods which are based on the principles of plant nutrition. One of these methods is called INFERS (Kee et al ., 1994) which follows the nutrient balance approach and plant nutrient demand. These are the foundations of modern plant nutrition in the field, and recently have been advanced for dealing with soil nutrient depletion in African agriculture in general (Smaling et al ., 1999; Corley and Tinker, 2003). Although a number of past papers have discussed nutrient balance approach (Hew and Ng, 1968; Ng, 1977), only the INFERS model has been described briefly by Kee et al . (1994) and Corley and Tinker (2003) to illustrate the approach for oil palm.
The nutrient balance approach specifically attempts to balance the nutrient demand with the nutrient supply. In the oil palm agro-ecosystem, the components of nutrient demand are plant nutrient uptake for growth and production, nutrient losses through soil processes such as runoff and leaching (environmental losses) and nutrient immobilization (Figure 1). The components of nutrient supply are precipitation, pruned fronds, applied by-products such as empty fruit bunches. Any shortfall between nutrient supply and demand is met by fertilizer input. Ng (1977) considered the major variables in the nutrient balance sheet to be soil nutrient supply to the oil palm and plant nutrient demand.

Note: POME denotes palm oil mill effluent while EFB denotes empty fruit bunches
Figure 1: Nutrient cycles for nitrogen in oil palm plantations
Plant nutrient demand is the requirement for essential elements by a growing plant (Corley and Tinker, 2003). It can be separated into two processes: growth demand and deficiency demand (Tinker and Nye, 2000). The underlying theory of these two “demands” is quoted verbatim from Corley and Tinker (2003) as follows:
Nutrient amount (content) in palm, N = XW and uptake rate = ![]() =
= ![]()
where N is the total nutrient in the palm, W is the mass, X is the fractional content of the nutrient and t is time. The first term in the uptake rate represents the growth demand because the nutrient percentage remains constant as the plant grows at a rate ![]() . However, during the correction of a nutrient deficiency, the second term applies, as the weight is a constant with varying nutrient concentration. In fact, both processes probably occur at the same time. Without the differentials and ignoring change in structure of plant material, a simple approximation for the uptake is:
. However, during the correction of a nutrient deficiency, the second term applies, as the weight is a constant with varying nutrient concentration. In fact, both processes probably occur at the same time. Without the differentials and ignoring change in structure of plant material, a simple approximation for the uptake is:
X 2 (W 2 – W 1) + W 1 (X 2 – X 1) = X 1 (W 2 – W 1) + W 2 (X 2 – X 1) = X 2 W 2 – X 1 W 1
for times t1 and t2 and the meaning of the terms remains the same.
The main components of growth demand in the oil palm are nutrients immobilized in palm tissue by growth and nutrients exported in the FFB. The major components of deficiency demand are increase in palm nutrient content to correct nutrient deficiency and increase in soil nutrients. Changing the present state in these four components to the optimum level and maintaining the optimum state are the central tenets of INFERS model. That is, these four components, FFB yield, growth (palm size), nutrient concentration in palm (usually the leaf nutrient concentration in Frond 17 is used as an indicator) and soil nutrient concentration, form the targets in INFERS. Since these targets differ according to palm age, environment and economic situation, the palm nutrient requirements will also vary. Coupled with different fertilizer use efficiency, the fertilizer rates required for each field will change accordingly. This is indeed the essence of site-specific fertilizer recommendations. A brief description of INFERS module for computing fertilizer rates using N as an example is provided below. The detailed structure of INFERS is provided by Kee et al. (1994) and Corley and Tinker (2003) while the research which supports the model has been well described by Corley and Tinker (2003).
Since INFERS is based on the principle of plant demand and nutrient supply, the four targets to be achieved or maintained must be set correctly. The first target is usually based on the site yield potential using a model called ASYP (Kee et al., 1999). The growth rate is based on the increasing dry weight of Frond 17 as determined from its dimension (Corley et al., 1971) with palm age. It should be noted that the growth rate of oil palm and the maximum frond dry weight depend on the environment. This information is freely available from many experiments conducted on oil palm in Malaysia. The target for the leaf nutrient concentration in Frond 17 may be based on single nutrient critical levels for different environment and palm age or TLC method as described earlier. Since four targets are used in the model, the computed fertilizer rates are less sensitive to changes in leaf nutrient concentration compared to the earlier methods discussed above. The target for soil nutrient contents depends on the soil nutrient classification table (Table 1) or user’s preference for nutrient buildup, maintenance or depletion although INFERS does not in principle aim to deplete soil nutrients.

Table 1: Classification of soil nutrient status for oil palm
The main nutrient demand in the oil palm agroecosystem is probably by the plant. The plant nutrient demand can be separated into four components: canopy, trunk, root and FFB. The equations to calculate the palm N demand are shown below. The figures in subscript, 1 and 2, denote time 1 (present state) and time 2 (a year later).
1. Nutrient demand of the canopy
Canopy N growth demand (g N/palm) = 0.155* (Pinnae N (%)1) (Frond17 dry weight (g)2– Frond17 dry weight (g)1)
Canopy N deficiency demand (g N/palm) = (0.155 * (Frond17 dry weight (g)2) – 236.817)* (Pinnae N (%)2 – Pinnae N (%)1)
where Frond 17 dry weight is measured using the non-destructive method of Corley et al . (1971) and Pinnae N is obtained from the standard leaf nutrient analysis adopted by the oil palm industry in Malaysia (Foster, 2003).
2. Nutrient demand of the trunk
Trunk N growth demand (g N/palm) = 0.01 * Trunk N concentration (%)1(Trunk dry weight (g)2 – Trunk dry weight (g)1)
Trunk N deficiency demand (g N/palm) = 0.01 * Trunk dry weight (g)2(Trunk N concentration (%)2 – Trunk N concentration (%)1)
The trunk N concentration (%) is estimated by the linear-plateau model as follows:
- Trunk N concentration (%) = 1.369 – 0.117 (age (yr)) for palm <= 8.5 years old
- Trunk N concentration (%) = 0.351 for palm > 8.5 years old
The trunk dry weight is estimated by the equations proposed by Corley and Bruere (1981) as follows:
- Trunk volume (cm3) = ? x d2x h /4
where d = trunk diameter (cm), usually measured at 1m above the ground
h = trunk height (cm), usually measured to Frond 41 - Trunk density (g/cm3) = 0.083 + 0.0076 (age (yr))
- Trunk dry weight (g) = Trunk volume x Trunk density
The above equations indicate that for palm above 8.5 years old, a constant value for growth demand of trunk may be used since height increment, diameter and N concentration in the trunk are constants and increase in trunk density is relatively small. Also, there is no deficiency demand due to constant trunk N concentration.
3. Nutrient demand of the roots
The N concentration in the roots of oil palm is relatively constant across palm age and soil types at about 0.39 %. Thus, oil palm roots are assumed to have no deficiency demand.
The growth demand of the oil palm roots is calculated using an empirical equation based on root:shoot ratio as follows:
Root:shoot ratio = 1.92 (Palm age (yr))-1.11
The difference in root weights between year 1 and year 2 is multiplied by the constant root N concentration to give the root N demand. It should be noted that the above equation to compute the root weight is based on palms with relatively good nutrition. It is known that root:shoot ratio tends to be higher for palms in poor nutritional state.
4. Nutrient demand of the FFB
At present, it is assumed that the N concentration of FFB is not affected by palm age or nutrition, and remains constant at 3.195 g N per kg FFB. Therefore, there is only growth demand by the production of FFB as follows:
FFB N growth demand (g N/palm) = FFB (kg)2 x 3.195
The soil nutrient demand generally involves two soil processes; soil nutrient build-up and soil nutrient losses. Soil nutrient build-up may be necessary if the soil nutrient status is low or where the soil activity ratio indicates nutrient imbalance as discussed earlier. The soil nutrient losses in the oil palm agroecosystem mainly arise from erosion, runoff and leaching. Corley and Tinker (2003) consider these losses as environmental losses or demand. The erosion and runoff losses can be estimated using the model suggested by Morgan et al. (1984) and leaching losses by Burn’s model (Burns, 1974). Although these sub-models are built into INFERS model, they require many state variables and parameters, and therefore are beyond the scope of this paper. In general, soil N losses through the above processes should not exceed 10 % if the fertilizer is properly applied and correctly timed. N volatilization losses from urea or urea based fertilizers can be considered as part of soil N demand but they are usually taken into account after computing the final fertilizer rate assuming no losses initially. That is, if one expects volatilization losses to be about 30 %, then the final N fertilizer rate is adjusted 30 % upwards.
The major nutrient supply in the oil palm agroecosystem is shown in Figure 3. INFERS assumes that nutrient supply from the atmospheric and rainfall deposition is small and no decrease in soil or plant nutrient content is expected unless done on purpose. For example, it is sometimes necessary to deplete, say soil exchangeable Ca and Mg which may be too high and causing poor K uptake as in ultrabasic soils or the palms on peat soils have too high N and too low K, by the appropriate fertilizer withdrawal. Similarly, the residual value of large dressings of phosphate rock and ground magnesium limestone (Goh et al., 1999b) can be up to three years’ demand and these nutrients can probably be omitted in such cases (Corley and Tinker, 2003). The nutrient supply from by-products such as empty fruit bunches (EFB) and palm oil mill effluent (POME) is well known and can be easily accounted for.
The computations of nutrient balance are subject to errors as in all mathematical and statistical models, and depend on reasonable or achievable targets. Thus, to prevent over manuring, INFERS has set a maximum N uptake rate of 1180 g per palm per year as measured under good environmental conditions.
The conversion of nutrient requirement of oil palm to fertilizer equivalent depends on the expected fertilizer efficiency at the site. Since fertilizer efficiency varies across sites, it is ideal that fertilizer response trials on similar soil types are available in the vicinity. In general, the N fertilizer efficiency in Malaysia varies from 30 to 70 %. This wide range in fertilizer efficiency is due to the very different environments where they were measured e.g. fertile coastal clays to infertile Malacca series soils. In reality, the average fertilizer efficiency over three years or more within a site is relatively similar. Therefore, the fertilizer efficiency at a site may be estimated from past fertilizer history and nutrient uptake rate as a first approximation as described step-by-step below.
1. Figure 2 shows a hypothetical response curve of nutrient uptake to fertilizer input. It generally follows a modified Mitscherlich equation or a linear-plateau model. Under an ideal situation, we should know three points:
- Point A: Nutrient uptake without fertilizer input i.e. soil nutrient supply
- Point C: Targeted nutrient uptake at the correct fertilizer rate
- Point B: Average last two to three years nutrient uptake at applied fertilizer rates
Point A and point C are usually unknown from past historical data although point A can be estimated using Foster’s soil based system as discussed earlier. However, point B and the targeted nutrient uptake line are known.

Figure 2: A hypothetical response curve of N nutrient uptake to N fertilizer input and a method to predict the N fertilizer rate for the following year
2. Point B can be calculated based on the model described earlier using the actual yield, dry weight and nutrient concentration in Frond No. 17.
3. The targeted nutrient uptake is calculated based on the targeted yield (site yield potential), dry weight and nutrient concentration in Frond No. 17 for the site.
4. We can then draw a tangent passing through point B to the targeted nutrient uptake line. The point where it cuts (point D) gives the estimated fertilizer rate. This generally underestimates the fertilizer requirement due to higher environmental demand (Corley and Tinker, 2003) with increasing fertilizer rate. We have not fully addressed this issue although a 10% higher rate for N and K appears satisfactory.
5. Another problem which has not been solved is the known fact that fertilizer use efficiency (FUE) declines with increasing fertilizer rate. It generally follows a declining exponential model, FUE = exp(-kF), where F is the fertilizer rate (kg/palm/yr) and k is a constant. This constant is mainly affected by fertilizer sources and environment.
6. This method avoids the necessity to estimate the fertilizer use efficiency and soil nutrient supply directly. However, it is highly dependant on a reasonable starting value (point B) and the targets to avoid over fertilization.
7. A reasonable point B can be obtained if one follows the six tools available to monitor palm health, and changes in soil nutrients and fertilizer use efficiency as listed below:
- Leaf nutrient status
- Soil nutrient status
- Nutrient deficiency symptoms
- Vegetative growth rate and canopy sizes (Classification)
- Yield (site yield potential)
- Fertilizer efficiency
An example showing the computation of N fertilizer rate (kg AC/palm/year) using INFERS model for the low N scenario as provided in the earlier illustrations of fertilizer recommendation systems is given below. The required variables measured in 1993 and 1994, and targets for 1995 are given in Table 2 and the calculated nutrient uptake and fertilizer rate are shown in Table 3. For simplicity, it is assumed that the soil N status is satisfactory and therefore, soil N demand is equaled to zero.

Table 2: Measurements made on oil palm planted in 1979 on Batang (lateritic) Family soil to demonstrate INFERS model

Table 3: Computed N uptake and N fertilizer rate based on variables in Table 16 using INFERS model
The calculated N fertilizer rate is similar to that of Foster’s system but it is the only known fertilizer recommendation system for oil palm that accounts for both deficiency ad growth demands explicitly. It also avoids the problem of dilution or concentration effect of leaf nutrient due to changing canopy sizes. The relatively low N fertilizer rate in the present example is due to the relatively high soil N supply as shown by the past historical data. In general, higher N rate is recommended to account for the decline in fertilizer use efficiency with increasing fertilizer rate due to higher N environmental losses if the first approximation method is used as discussed above. This implies that the model tends to underestimate the fertilizer requirements of oil palm when the initial fertilizer rates are far below the optimum rates. However, the error gets smaller as the recommended fertilizer rates move towards the optimum rates and from experience, the model outputs converge within 3 years under the worst scenario.
INFERS model requires at least 3 targets as discussed above, and if they are wrongly set, then the estimated fertilizer rates will be incorrect. Thus, it requires the agronomist to know the fields well, have a good understanding of oil palm physiology and agronomy, be aware of the management practices and resources available, and have the ability to judge the reliability of the data for the model and decision making including the impact of spatio-temporal variation.
Reference
Goh, K.J. (2005). Fertilizer recommendation systems for oil palm: estimating the fertiliser rates. In: Chew, P.S. and Tan, Y.P. (eds) Proceedings of MOSTA Best Practices Workshops – Agronomy and Crop Management. Malaysian Oil Scientists’ and Technologists’ Association (MOSTA): 235-268.
Note: The full list of references quoted in this article is available from the above paper.
Fertilizer Management: Nutrient Losses
[addw2p name=”fertilizerMgmt”]
Nutrient losses
Land-clearing and preparation
Runoff and topsoil erosion
Leaching
Soil indigenous and fertilizer nutrients that are not taken up by the palm or adsorbed onto soil particles are dissolved and lost through surface runoff, volatilization, denitrification, or leaching. Adsorbed nutrients may also be lost in eroded soil and sediments.
Losses are more pronounced at particular phases in the life of an oil palm plantation. The potential for nutrient losses is probably greatest immediately after land-clearing when the soil surface is exposed to erosion and uncontrolled surface runoff losses before legume cover plants (LCP) have been established. Losses can be great when large amounts of nutrients such as potassium (K) are released when the standing biomass (e.g. fronds, trunks) is burned during plantation development.
The other period when the risk of nutrient losses is high occurs when ground vegetation is sparse due to poor light penetration through the closed oil palm canopy (Breure, this volume). At canopy closure, the LCP dies off and a large amount of nitrogen (N) is released from the decomposing LCP biomass. Unless palm growth is vigorous, losses of mineralized N due to leaching are likely to be large.
Nutrient losses are more pronounced in areas of the plantation where steep topography and inadequate soil conservation measures result in erosion and uncontrolled surface wash. Clearly, a proper assessment must take account of these temporal and spatial aspects of the potential for nutrient losses.
Leaching losses are more prevalent in coarse-textured soils in high rainfall areas where large fertilizer application rates are required but fertilizer recovery efficiency is poor. Nitrogen may be lost to the atmosphere due to volatilization but, as we shall see, N fertilizers differ in their susceptibility to volatilization losses, which are also affected by the field conditions when the fertilizers are applied.
Oil palm is planted on a variety of land types:
-
Logged primary or secondary forest land.
-
Land abandoned to alang-alang (Imperata cylindrica) after a period under slash-andburn agriculture.
-
Land replanted from plantation crops (e.g. rubber, cocoa, oil palm).
Proper land-clearing techniques are required in order to conserve indigenous soil nutrient supplies and the nutrients returned to the soil in the cleared biomass (Gillbanks, this volume). In the past, when tropical rainforest was converted to oil palm, the felled trees and the organic residues of the previous vegetation were often burned to make field operations (i.e. lining, planting, drainage) easier and thus reduce labor costs, but large amounts of N and sulfur (S) were lost to the atmosphere in the process.
In an experiment to measure the effects of burning biomass on soil properties in Benin, West Africa on acid sand, soil chemical properties and yield were measured at 20 years (Trial A) and 10 years (Trial B) after planting (Sly and Tinker, 1962). In Trial A, there was a significant increase in soil exchangeable K in the burnt treatment (Table 1) but in Trial B, exchangeable Ca and Na, organic carbon and total N were larger in the unburnt treatment (Table 1).

In the first four years of production, yield was larger in the burnt treatment (Trial A) but there were no significant differences in yield when averaged over 11 years of production. The authors concluded that the burning of felled forest under typical Nigerian conditions was not detrimental to later growth and yield of oil palms, and has definite practical advantages in implementing field work (Sly and Tinker, 1962).
Foong (1984) measured soil chemical properties of a virgin Munchong (Typic Hapludox) soil at intervals after land-clearing and LCP establishment (Table 2). Six months after land-clearing, there was a discernible increase in soil pH due to the liming effect of the ash from the burnt vegetation. This seemed to be a temporary effect, as soil pH decreased to 3.9–4.0 thereafter. Total phosphorus (P) content also decreased after land-clearing but was increased substantially after planting LCP, due to the application of phosphate rock during the establishment of legume cover plants (LCP). Organic carbon (C) and total N also decreased at first, but were replenished by the LCP at 62 months after land-clearing when the LCP was shaded out by the oil palm canopy. There were small changes in soil available P and exchangeable K over the period monitored, but there was an increase in soil Ca and Mg. Thus, with proper LCP establishment, soil chemical properties could be maintained or even improved at this site during the first five years after planting (YAP).

In recent years, burning has been prohibited by legislation in Malaysia and Indonesia in response to concerns about environmental pollution and zero-burn land-clearing techniques were developed (Mohd. Hashim et al., 1993). Zero-burn replanting techniques may contribute to improved soil physical and chemical properties because the large quantity of biomass and nutrients contained in palm trunks and fronds is conserved and returned to the soil (Goh and Härdter, this volume; Redshaw, this volume). Felled trunks and fronds should be chipped and spread over the soil surface to provide mulch, reduce localized nutrient build-up, and minimize potential leaching losses.
Although zero-burn replanting techniques are currently the norm in the oil palm industry, it should be pointed out that pest control measures may be exacerbated due to an increase in the population of Oryctes beetles and rats. Thus, whilst zero burn land clearing results in reduced smoke emissions and improved soil properties it amy also result in an increase in pesticide use.
It should be remembered that the cost of replenishing soil fertility is almost always larger than the cost of implementing proper land clearing, land preparation and soil erosion control techniques that contribute to the conservation of indigenous nutrient supplies. Mechanical clearing and burning can result in increased surface runoff, topsoil erosion, leaching, N-volatilization, and P-sorption (von Uexküll, 1986). Soil damage during site preparation may be so severe that LCP establishment is greatly impaired, and this must be avoided.
Surface runoff water is the amount of water contained in rainfall and runoff received from higher elevations that does not infiltrate the soil. Runoff is greater where the soil structure has been damaged due to compaction, which causes a reduction in the soil water infiltration rate. In a study in West Sumatra on 10-yearold oil palms, significant spatial variability was found when soil water infiltration rates in the soil beneath the palm circle, path and frond stack were compared. Infiltration rate increased in the order path < circle < frond stack. The larger infiltration rate in the frond stack was attributed to the effect of pruned fronds on soil structure. The smaller infiltration rate in the circle and path was related to soil compaction due to wheelbarrow and human traffic (Fairhurst, 1996).
In a simulation study of in-field transport of fruit bunches and fertilizers, Tan and Ooi (2002) showed that infiltration rate in the mechanization path could be reduced to zero after 24 runs by a 2.3 t mini-tractor grabber carrying a 1 t load. Thus, the use of low ground pressure vehicles for infield transport is strongly advocated to reduce soil compaction.
Soil erosion occurs when soil cover is poor and particles of soil are detached by raindrops and carried offsite. Preventive strategies include the installation of erosion bunds (on slightly sloping land), palm platforms (on sloping land), and contour terraces (on steeply sloping land) (Gillbanks, this volume). Nutrient loss due to erosion are greater on steep slopes are where rainfall intensity is greater, but losses can be reduced by improving soil cover and installing soil conservation structures (Kee and Chew, 1996). It is therefore very important to practice selective weeding in mature oil palm plantations to preserve groundcover and reduce the amount of nutrients lost in surface runoff and eroded soil. When properly arranged in the inter-rows, pruned fronds are an important means to reduce run-off and erosion and thus should not be removed from the field for other purposes (Redshaw, this volume).
The amount of nutrients lost due to runoff and topsoil erosion may be large (Maene et al., 1979) (Table 3) and are usually greater than losses due to leaching. Losses of N and boron (B) in runoff water were greater than 10% of the amount applied as fertilizer, but losses were smaller for the nutrients K, magnesium (Mg) and P (Table 3). This was probably due to the greater solubility of N and B fertilizers and the adsorption of K, Mg and P on soil complex. Losses from surface runoff were larger in the uncovered soil in the harvest path, compared to the interrows, where pruned fronds provide soil cover (Table 3) and improve soil structure and the rate of water infiltration (Fairhurst, 1996).

Other studies indicate that the amount of fertilizer nutrients lost due to surface runoff could be related to the amount and intensity of rainfall immediately after fertilizer application. Kee and Chew (1996) found that N concentrations in runoff water collected after the first rain event following fertilizer application in the wet month of October were 89 mg kg-1 for Rate 1 at 65 kg N ha-1 and 135mg kg-1 for Rate 2 at 130 kg N ha-1, compared to 4 mg kg-1 in the control plot.
During the dry period when there was no rain for five days after fertilizer application, however, the N concentrations in the runoff water collected after the first rain event were much lower at 30 mg kg-1 (Rate 2), and <5 mg kg-1 (Rate 1 and the control plot). The drier soil surface appeared to result in an increase in the infiltration rate and thus a greater proportion of applied fertilizer was washed into the soil. Similar trends were observed for P, K and Mg fertilizers.
Phosphorus is more likely to be lost due to sheet erosion as it is less soluble than other nutrients and is held strongly on soil particles (particularly in highly weathered inland and upland soils). Sheet erosion also results in the loss of organic matter that forms an important part of the cation exchange capacity in highly weathered tropical soils. Steeply sloping inland and upland soils are more vulnerable to sheet erosion, and thus the effect of erosion on soil fertility in these soils is more pronounced. The subsoil in highly weathered soils is characterized by low cation exchange capacity (CEC) and the presence of small concentrations of plant available K, P, and Mg. The subsoil is thus a less-favorable environment for root growth and root activity, particularly if the concentrations of Al3+, H+ and Mn2+ are large due to low soil pH. For these reasons, the concentration of oil palm feeder roots is greatest in the upper 30 cm of soil (Ng, et al., on botany, this volume). Cover plants are very difficult to establish on areas affected by sheet erosion, and usually soil P must first be replenished before a full LCP canopy can be established. The importance of LCP in soil conservation is illustrated by Ling et al. (1974) in an experiment in Malaysia where runoff and soil loss decreased from 22% under bare soil conditions to 1% where soil surface was covered with LCP (Figure 1).

To summarize, measures to minimize nutrient losses due to surface runoff and soil erosion include the following:
- Maintain adequate groundcover by selective weeding, so that harvesting is not obstructed and competition from weeds is minimized,
- Implement contour planting with properly designed terraces and platforms on steep land,
- Align cut fronds along the contour,
- Mulch with empty fruit bunches,
- Avoid fertilizer application when heavy rainfall is likely to occur, and
- Install contour soil bunds.
Leaching losses occur when nutrients are dissolved into the drainage water as it percolates through the soil profile. Leaching is particularly problematic on coarse-textured soils in the humid tropics where rainfall exceeds evapo-transpiration. Other factors that affect nutrient losses by leaching include soil pore size, rainfall intensity, the initial water content of the soil, and the amount and timing of fertilizer application. The cations Ca2+, Mg2+, and K+ and the anions NO3 – and Cl– are most prone to leaching (Foong, 1993) (Table 4). Leaching losses are generally larger in older palms, probably because larger amounts of fertilizer have been applied.

In a catchment study in the same plantation where Foong (1993) conducted an experiment on leaching losses, the exceptionally large Mg losses were attributed to the excessive application of kieserite and the application of N and K fertilizers that displaced Mg from cation exchange sites into the soil solution. Losses of P were very small, due to its comparative immobility in the soil (Chang et al., 1994).
In a study on nutrient leaching on Orlu and Algba series (Rhodic Paleudult) soils in Nigeria, Omoti et al. (1983) distinguished between nutrients originating from the soil indigenous supply and nutrients added in mineral fertilizers by using fertilized and unfertilized lysimeters installed 60 cm below the soil surface. Losses of NH4-N and K were small in young palms in the absence of fertilizer, but for all nutrients, leaching losses from fertilizer were smaller in the older palms compared with the young palms (Table 5).
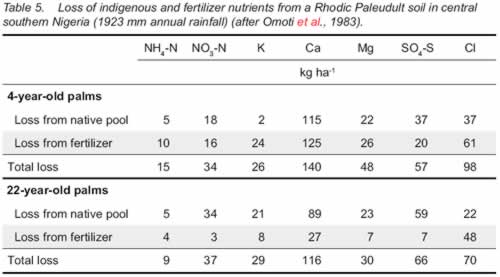
This outcome is to be expected since the older palms have better root system to absorb applied and indigenous soil nutrients, a larger demand for nutrients, and a higher transpiration rate with a consequent lower water balance for leaching.
Losses of NO3-N, K and SO4-S all were greater in the unfertilized soil in older palms compared with young palms, presumably because of nutrient accumulation in the soils due to fertilization prior to the measurements (Table 5).
Calcium was leached in the greatest quantity followed by Cl, SO4-S, and Mg. As could be expected, losses of NO3-N were greater than of NH4-N. It appears that Ca was the main carrier for the anions in these soils, probably due to the relatively low K rate applied during the experiment.
Clearly, there is a wide difference between nutrients in terms of their susceptibility to leaching. Nutrient losses may be large, particularly where organic matter status of the soil is low, in coarse-textured soils, and in areas with high rainfall.
To summarize, measures to minimize nutrient losses due to leaching include the following:
- Implement balanced nutrition (nutrients supplied according to crop demand).
- Split large application rates into a number of smaller doses (particularly for N, K, and Mg).
- Spread fertilizers evenly to maximize contact with the root system.
- Avoid fertilizer application during periods of heavy rainfall (by using statistical techniques or expert systems to predict the occurrence of dry periods).
- Apply empty bunches and cut fronds to increase soil organic status and cation exchange capacity.
- Increase the soil pH through liming to increase soil cation exchange capacity in variable charge soils
Reference
Goh K.J., Rolf Härdter and Thomas F. (2003) Fertilizing for maximum return. In: Thomas Fairhurst and Rolf Hardter (eds). Oil palm: Management for large and sustainable yields. Potash & Phosphate Institute and International Potash Institute: 279-306
Note: The full list of references quoted in this article is available from the above paper.
Fertilizer Management: Application
[addw2p name=”fertilizerMgmt”]
Once the amount required and source of each fertilizer nutrient has been determined (Foster, 2003), a strategy for the placement, and frequency and timing of application must be considered.
Strategies for the placement of fertilizer
Frequency and timing of fertilizer application
Timing of fertilizer application
Strategies for the placement of fertilizer
It is axiomatic that fertilizers should be placed where they can most readily be absorbed by feeding roots of the crop. The proportion of the soil volume exploited by the oil palm increases with palm age (Ng et al ., 1968; Ruer, 1967) but the rate of expansion depended on soil type (Tan, 1976). Palms absorbed labeled 32P applied over 30 m from the point of application, even when the palms were separated by a 65 cm deep trench (Zaharah et al ., 1989). Physical disturbance of the soil in the path inter-row due to mechanized fruit collection also affected root growth in this zone (Mokhtaruddin et al ., 1992) and the quantity of roots was increased by more than 20% following sub-soiling of compacted palm inter-rows (Caliman et al ., 1990b).
Based on cursory investigations in the field, it is sometimes asserted that there are generally more active feeder roots in the soil beneath the frond stack compared with soil from beneath the weeded circle. In a detailed study in West Sumatra on palms 10 YAP, however, no difference was found in feeder root length density between these two zones but root length density was smaller in soil beneath the harvesting path, where the soil was more compacted than the other two zones due to frequent wheelbarrow traffic (Fairhurst, 1996) (Figure 1). In the soil beneath the area where fertilizer had been applied, root length density was greater, suggesting that roots proliferate where the concentration of nutrients is greatest (Figure 2). Other workers reported the positive tropism of oil palm roots towards areas with better water and nutrient supply, with a greater concentration of roots in soil beneath the frond stack in the palm inter line (Bachy, 1964; Tailliez, 1971), and at the edge of palm circles where there had been an accumulation of organic debris (Purvis, 1956). The quantity of roots in soil beneath the harvesting path was reported to be small (Hartley, 1977).

Figure 1. Contour map showing root length density (RLD) in a transect between three palms across the harvest path and frond stack interrows in a field of palms in West Sumatra 10 years after field planting (Fairhurst, 1996).

Figure 2. Root length density of primary, secondary, tertiary and quaternary roots in the circle facing the front stack (Circle S) and harvest path (Circle P), and frond stack in a field of palms in West Sumatra 10 years after field planting (Fairhurst, 1996). [Bars represent standard error of the means, n=7)
Fertilizer application rates may be very large, particularly when the rate is calculated based on the area of soil over which the fertilizer is applied. Palm circles occupy only 20% of the soil surface area under oil palm and thus, for example, 1.5 kg palm-1 urea applied over the weeded circle is equivalent to an application of 1,000 kg ha-1.
From an agronomic point of view the application of fertilizers over the weeded circle would, at first, appear to be unsatisfactory because
-
the root system in mature palms extends far beyond the boundary of the weeded circle (Ng, et al ., on botany, this volume),
-
the soil beneath the circle may have insufficient cation exchange capacity to store the large amount K and Mg applied but not immediately taken up by the palm, resulting in increased leaching losses,
-
the application of large amounts of a particular cation (e.g. K) may result in the displacement and leaching of another cation (e.g. Ca), and
-
the application of large quantities of urea and sulfate of ammonia may cause soil acidification (and a consequent reduction in cation exchange capacity in variable charge soils).
Some arguments can be made in favor of fertilizer placement over the frond stack:
- Soil P fixation is reduced due to the effect of organic residues on soil properties.
- There may be a greater proportion of fine feeder roots (tertiary and quaternary roots) in soil beneath the frond stack.
- Surface wash of fertilizers may be reduced by the protective layer of pruned fronds lying on the soil surface.
The infiltration rate in soil beneath the frond stack is more rapid, however, and this may result in greater losses of K and Mg fertilizers due to leaching. Since the water infiltration rate in the soil in the weeded circle is often reduced due to compaction, however, fertilizers applied over the weeded circle may be washed out and distributed over the surrounding area. Clearly, the selection of a suitable placement strategy must take into account the nature of the fertilizer material, the particular nutrient applied and the age of the palms.
There are three reasons why there was, in the past, a tendency to apply fertilizers over the circle:
- First, some of the N supplied in fertilizers applied over the inter-row will be taken up by ground cover vegetation and lost when slashed ground vegetation decomposes on the soil surface,
- Second, N volatilization losses are greater when urea is applied over decomposing organic debris where urease activity is greater, and
- Third, it is much easier for the manager to verify that fertilizers have actually been applied and spread properly when they are applied over the weeded circle.
We will now review some past experiments that investigated the effect of fertilizer placement on nutrient use efficiency. Fertilizer placement studies have generally produced inconclusive results despite large yield responses to fertilizer in a number of experiments (Table 1). In fertilizer experiments carried out in Malaysia, yield was larger when P was applied in the harvest path avenue compared to the frond stack and circle, and when K was applied in the frond stack compared to the circle (Foster and Dolmat, 1986). In contrast, Teoh and Chew (1985) and Yeow et al ., (1982) found no difference in yield between different placement strategies. Of particular interest is the increased response to fertilizer in experiments carried out in Malaysia when palm fronds were broadcast over the inter-rows compared to the placement of fronds in alternate palm rows, and when fertilizer was applied together with an application of 3.5 t ha-1 empty bunches (Chan et al ., 1993). To summarize, fertilizer application over clean weeded palm circles, over the outside edge of the weeded circle, or over the frond stack gave similar yield responses in mature oil palms planted on coastal soils, NPK fertilizer could be applied in alternate avenues in the oil palm plantations without reducing efficiency.

Table 1 . Effect of fertilizer placement on bunch yield in Malaysia.
Foster and Tayeb (1986) measured the effect of different fertilizer placement strategies on yield of palms 7-9 and 10-11 YAP (Figure 3). Very similar results were obtained for both age groups:
- With one application of N per year, yield was greater when N fertilizer was applied over the weeded circle, but when N was supplied in three applications, there was no difference between the placement strategies.
- Phosphorus was most effective when broadcast over the avenue, while K was most effective when broadcast over frond stack (Figure 3).
Goh et al . (1996) measured K uptake indirectly in an experiment with palms 16 YAP on a Rengam Series soil (Typic Paleudult). Two 1-m2 plots were marked within each microsite, i.e. palm circle, interrow, frond stack and harvest path. At each micro site, one plot was isolated by a trench (0.3 m wide x 0.9 m deep) and K uptake was estimated from total K contents in the 1-m2 plots by difference. The plots were allowed to settle for a year before K fertilizer treatment (500 kg K ha-1) was applied. In the fertilized plots, K uptake was greatest in the palm circle, followed by the inter-row, frond stack and harvest path, where uptake was probably affected by soil compaction (Table 2). In unfertilized plots, K uptake was greatest in the palm circle where the concentration of exchangeable K (0.22 cmol kg-1) was the smallest of the areas sampled.

Figure 3a. Effects of different fertilizer N placement strategies on bunch yield in oil palm at 7-9 and 10-11 years after field planting (Foster and Tayeb, 1986).


Figure 3c. Effects of different fertilizer K placement strategies on bunch yield in oil palm at 7-9 and 10-11 years after field planting (Foster and Tayeb, 1986).

Table 2 . Effect of frequency of fertilizer application on oil palm yield in Malaysia.
In addition to nutrients supplied in fertilizer, small quantities of nutrients may be added in rainfall. Annual rainfall of 2,000 mm in Malaysia contained about 5 kg K ha-1 yr-1 but a substantial amount of K was leached from the canopy resulting in the addition of 36 kg ha-1 yr-1 to the soil in through-fall (Goh et al ., 1994).
One reason for the inconclusive results in past investigations on the effect of fertilizer placement is that gradients in root distribution may already have been established at the start of each experiment. Thus, when treatments to compare broadcast fertilizer with application in weeded circles are installed in a field of palms where root gradients are already pronounced, nutrient uptake is likely to be less efficient in areas of the field that have not received fertilizer or pruned fronds in the past, such as the harvest path, and where root development is poor. Ideally experiments on fertilizer placement should be established in fields of young palms so that both uptake efficiency and the effect of nutrients on root development are taken into account.
Broadcasting fertilizers over the entire soil surface under mature palms has also been advocated because it results in an overall buildup of soil fertility (and probably more uniform root distribution), avoids excessive nutrient buildup (and acidification) in the palm circle, and reduces leaching losses of K and Mg in the palm circle. Clearly, fertilizer placement is not an issue in plantations that have changed to mechanical fertilizer application due a shortage of labor for manual application. Fertilizer use efficiency may increase where fertilizers are broadcast due to more even root distribution.
Fertilizer placement strategies for mature palms must take into account the characteristics of each fertilizer, oil palm root development and palm age (Table 3). Placement strategies should also be adjusted to take into account soil properties, weed management (some companies prefer bareground conditions or sparse vegetation favoring fertilizer application in the palm circle), and rainfall distribution.
It is recommended that bunch ash is applied around the weeded circle to palms 4 -7 YAP, and outside the weeded circle in palms >7 YAP .

Table 3. Recommendations for fertilizer placement by manual application for oil palm.
Frequency and timing of fertilizer application
Hew and Ng (1968) showed that uptake efficiency was increased with more frequent applications of fertilizer and designed a schedule for fertilizer application according to tree age and fertilizer source.
The frequency of fertilizer application is constrained by
-
the time it takes to apply a single application of fertilizer in a management unit,
-
the number of fertilizers that must be applied in a year, and
-
the requirement for a period of two months without fertilizer application prior to leaf sampling.
Thus, there is potential for ten fertilizer ‘applications in a year assuming one application can be completed within a month in a single management unit of 1,000 ha. The most suitable frequency for fertilizer application depends on:
-
the nutrient’s susceptibility to leaching,
-
the soil’s capacity for nutrient retention, and
-
local patterns of rainfall distribution and intensity.
Because NO3– produced from the mineralization of N-fertilizer is highly susceptible to leaching, more frequent applications may be required for N fertilizers than for P fertilizers, which are comparatively immobile in the soil. Frequency of K and Mg application should be related to soil clay content and mineralogy, and the soil’s cation exchange capacity.
On a sandy soil in Malaysia, the yield response to P, applied as rock phosphate was greater when applied annually compared to once in four years, but frequency of application had no effect on leaf P content (Foong and Sofi, 1995) (Table 4). Larger yields were obtained when N, P, and K were applied three times a year compared to once a year on a Rengam soil (sandy clay texture) with small cation exchange capacity (<10 cmol kg-1) (Foster and tayeb, 1986) but on Serdang (silty clay loam texture) and Munchong (clay texture) soils with a small cation exchange capacity there was no advantage from increased frequency of application of NK fertilizer, provided fertilizers were applied during periods of low rainfall (Teoh and Chew, 1985) (Table 4). Results from other fertilizer frequency experiments on mature oil palms are more equivocal (Chan et al ., 1993; Chan et al ., 1994) (Table 4). The general trends showed that N, K, and NK fertilizers could be applied once a year for optimum yield, while the less-soluble phosphate rock could be applied in alternate years. It should be noted, however, that these experiments used soluble fertilizers on heavy textured sandy-clay to heavy-clay soils and may not be applicable to light-textured soils.
Although humid tropical climates with annual rainfall of 2000 – 2,500 mm imply the loss of large amounts of nutrients through leaching, the large evaporative demand of oil palms suggests that leaching losses may in fact be small (Chang and Chow, 1985). Nutrients lost by leaching represented between 2-5 % of the nutrient content of fertilizers applied to a clay loam soil in a lysimeter planted with oil palms and legume cover crop where annual rainfall was 1,800-3,000 mm. Losses were different for each nutrient, increasing in the order P<N=K<Mg, and the largest losses occurred during periods when monthly rainfall exceeded 200 mm (Foong, 1993). In contrast, on an acid sand soil in Nigeria where annual rainfall was 2,000 mm, 34, 18, 172, and 60 % respectively of the fertilizer N, K, Ca, and Mg were leached from the soil in an experiment in which lysimeters were installed 150 cm below the palm circle. These two experiments illustrate the larger amounts of nutrients, which may be lost through leaching on coarse textured sandy soils (probably with small cation exchange capacity) compared to clay soils.

Table 4. Estimated K uptake by oil palm from different soil zones on a Rengam Series (Typic Paleudult) soil in Malaysia (Goh et al ., 1996).
To summarize, whilst there is no empirical proof that increasing the frequency of application always increases uptake efficiency, it is common practice to apply N and K fertilizers 2-3 times per year to reduce the risk of nutrient losses, and kieserite and rock phosphate once per year. Application frequency is usually increased in very young palms where, for practical reasons, the use of compound and mixed fertilizers (mixtures) supplemented with straight fertilizers is common. Fertilizers are spread much more evenly with mechanical application when compared with manual application and it may be possible to decrease the frequency and increase the application rate at each dose without adversely affecting uptake efficiency.
It is clear that applying very large amounts of fertilizer to any crop at one time may result in large losses due to leaching, surface runoff and erosion. The planter must therefore attempt to synchronize the supply of mineral fertilizer nutrients with palm demand. Unlike annual crops, the demand for nutrients in oil palm is continuous and in the end, the optimal frequency is a compromise between meeting nutrient demand, and supplying these nutrients without incurring excessive labor costs or organizational difficulties.
Timing of fertilizer application
Very little has been published on the effect of the timing of fertilizer application on fertilizer use efficiency (Teoh and Chew, 1980). Runoff losses, however, can exceed 45% of rainfall during months with high rainfall (November-December). Unlike other crops, where fertilizer application must be timed according to particular phases of vegetative and generative growth, the oil palm produces bunches throughout the year and thus requires a continuous supply of nutrients. The importance of timing is thus mainly related to the use of N fertilizers that are susceptible to loss by volatilization (Thompson, 2003). It may be possible to improve the timing of N fertilizer application by taking into account rainfall patterns and distribution and for this purpose each plantation should install a rain gauge (mm month-1) and a pluviometer (rainfall distribution during each day). To optimize recovery efficiency of N from urea, applications should always be followed by light rain and urea should never be applied to dry soil.
To summarize, fertilizer application should be avoided during months with a high probability of rainfall exceeding 250 mm month-1 and months with >15 rain-days. Losses of soluble P, K, and Mg fertilizers from runoff are smaller if applied in dry months (<100 mm month-1) in Malaysia.
Details on placement, frequency and timing of fertilizer application can be found under deficiency page.
 |
 |
|
Apply fertilizer in terrace area manually. Fertilizer brought in by buffalo |
Applying fertilizer manually (Photo taken by GKJ)
|
 |
 |
|
Well spread out fertilizer mixture (Photos taken by GKJ)
|
|
 |
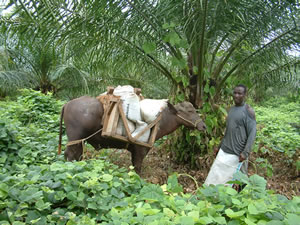 |
|
Using buffalo to deliver fertilizers in terraced areas (Photos taken by GKJ)
|
|
 |
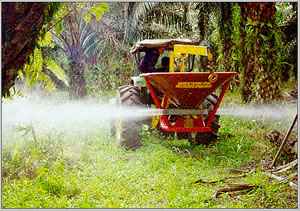 |
|
Aerial application (Photo – courtesy of Chung GF)
|
Mechanical spreader to apply fertilizer (Photo taken by OLH)
|
Reference
Goh K.J., Rolf Härdter and Thomas F. (2003) Fertilizing for maximum return. In: Thomas Fairhurst and Rolf Hardter (eds). Oil palm: Management for large and sustainable yields. Potash & Phosphate Institute and International Potash Institute: 279-306
Note: The full list of references quoted in this article is available from the above paper.
Fertilizer Management: Sources
[addw2p name=”fertilizerMgmt”]
A wide range of fertilizer products is available on the market. The choice of fertilizer depends on the following factors:
-
Nutrients required.
-
Availability of fertilizers.
-
Physical and chemical properties (nutrient concentration, availability) of fertilizers.
-
Cost ($ kg-1 N, P, K, Mg, B, and Cu).
-
Soil characteristics (pH, clay content and type, texture).
-
Terrain (e.g. flat, sloping, hilly).
-
Palm age and condition.
-
Climate.
-
Availability of labor.
In general, the water soluble fertilizers are used for immature palms, correction of nutrient deficiencies, and aerial application. Water insoluble fertilizers (e.g. dolomite, rock phosphate) are used on acid soils to provide a sustained slow release of nutrients, to counter the acidifying effect of urea and SOA, and to build up soil fertility. The common fertilizers used in oil palm are listed by Goh and Härdter (2003) and a comprehensive account is given by Chew et al. (1994). Also, the common sources of fertilizers for each nutrient are described under Deficiency section.
Reference
Goh K.J., Rolf Härdter and Thomas F. (2003) Fertilizing for maximum return. In: Thomas Fairhurst and Rolf Hardter (eds). Oil palm: Management for large and sustainable yields. Potash & Phosphate Institute and International Potash Institute: 279-306
Note: The full list of references quoted in this article is available from the above paper.
Fertilizer Management: Toxicity
[addw2p name=”fertilizerMgmt”]
|
Aluminum toxicity is widespread in the humid tropics where soils are acid and highly weathered. Low pH results in the accumulation of soluble Al in the soil that reduces root growth and impairs root function. Aluminum toxicity is thus manifested in the appearance of Mg and K deficiency, particularly in young palms but can be corrected by applying rock phosphate or dolomite at planting to ameliorate soil pH. Magnesium fertilizers have also been shown to reduce the effect of Al toxicity on plant growth for a variety of crops (Grimme and Härdter, 1991). |
||
|
Nickel toxicity can be a difficult problem in soils derived from ultrabasic or ‘serpentine’ rocks. Palms affected by Ni toxicity exhibit narrow, fish-net like chlorotic patterns on younger leaves, and growth can be severely retarded. Nickel toxicity is difficult to correct and, whilst mulching with EFB (where available), liming, and additional K fertilizer may help to alleviate the symptoms, it is not recommended to plant oil palm on ultrabasic soils. Some sources of poor quality rock phosphate are also known to contain a large concentration of Ni, and these fertilizer materials should not be used. |
||
|
Micronutrient toxicities are rare under humid tropical conditions and are usually only found after excessive application of micronutrient fertilizers. Great care must be taken when choosing the application rate for micronutrient fertilizers since the difference between deficiency and toxicity is often quite small. Copper toxicities may develop as a result of excessive and careless fertilizer application, the latter especially from excessive use of Cu-containing fungicides. |
||
|
Copper toxicity symptoms first appear as small, oval or round, light brown spots on the leaf surface. The spots have depressed centers and may coalesce into extensive necrotic areas with yellow margins on the leaf surface. |
||
|
Boron toxicity symptoms start on the younger leaves where interveinal chlorotic streaks appear on leaf tips. Chlorosis is rapidly followed by necrosis, developing from the distal to proximal end of leaves. Boron toxicity may be corrected by the application of N fertilizers, which precipitate B and improve palm growth by diluting the concentration of B in palm tissue. |
||
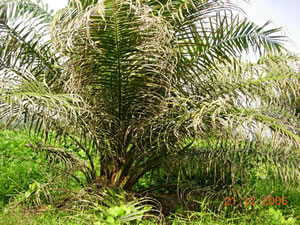 |
 |
|
|
Boron toxicity
|
||
|
The application of molybdenum to palms as foliar spray resulted in a decrease in yield in young palms on an acid sand soil in Nigeria (Ataga et al ., 1982). Bunch yield was also reduced when palms were treated with a foliar spray of manganese. In both cases, however, no leaf symptoms were reported. |
||
 |
 |
|
|
Excessive application of soluble fertilizer may lead to fertilizer scorch to the oil palm canopy
|
Agronomic team (Zulkifli, GHH, AS, HR) examining hyperacidity problem of oil palm on deep peat
|
|
|
The hyperacidity disorder can be found on palms planted on excessively drained acid sulfate and peat soils. Typical symptoms include the gradual necrosis and desiccation of leaflets on lower fronds, but the spear and young leaves are not affected. Liming with dolomite or BA is not very effective and hyperacidity can be better prevented by maintaining the water-table just above the jarosite layer or 30 cm from the surface, whichever is lower. |
||
 |
 |
|
|
Hyperacidity
|
Hyperacidity – damage to rachis
|
|
|
(Photos taken by GKJ)
|
||
|
Reference
Goh K.J. and Rolf Härdter (2003) General oil palm nutrition. In: Thomas Fairhurst and Rolf Hardter (eds). Oil palm: Management for large and sustainable yields. Potash & Phosphate Institute and International Potash Institute: 191-230 |
||
|
Note: The full list of references quoted in this article is available from the above paper.
|
||
Fertilizer Management: Principles
[addw2p name=”fertilizerMgmt”]
Objectives of fertiliser management
Computation of fertiliser requirement
Balanced fertilisation
Potential nutrient losses and environmental concerns
Economics of fertiliser recommendations
Additional agronomic principles for young palms
Objectives of fertiliser management
i) The objectives of fertiliser management in oil palm used to be straightforward as follows:
- To supply each palm with adequate nutrients in balanced proportion to ensure healthy vegetative growth and optimum economic FFB yields.
- To apply the fertilisers in the prescribed manner over the areas of the estate that are likely to result in the most efficient uptake of nutrients.
- To integrate the use of mineral fertilisers and palm residues.
ii) However, the following conditions make achieving the objectives a challenge nowadays:
- Shortage of reliable and skilled workers, and high turn-over in work force.
- Environmental concerns which are related to over-fertilisation, land degradation, and pollution from heavy metals e.g. cobalt and eutrophication by P.
- Expansion of oil palm into areas with little information on the soil properties, climate etc which are necessary for good fertiliser management e.g. the cultivation of oil palms on ultrabasic soils.
- Managing larger manuring blocks which can result in over generalisation. In fact, this approach goes against the current trend of site-specific fertiliser management and precision agriculture.
- Rising fertiliser prices which increase production costs.
- Planting oil palm in countries where lack of clear law and order or understanding them can be a yield-limiting factor e.g. Indonesia and southern Phillipines.
iii) Therefore, the agronomic principles of an effective fertiliser management should take all the above into account and balance the above needs and objectives with the resources in the estates. The key steps are:
- Determine the growth and yield targets.
- Assess the nutrient requirements to attain the above and prevent the occurrence of nutrient deficiency.
- Assess the management level and resources of the estate.
- Ascertain the most efficient and cost effective fertilisers and applications of fertilisers to meet the nutrient requirements.
- Compute the economics of the recommendations and expected results.
- Monitor the outcome including the economic returns.
- Decide on further action required and repeat the steps if necessary.
iv) Most of these steps should be covered by other lectures in this course but for completeness and comprehensibility of our lecture, we shall briefly discuss them.
Computation of fertiliser requirement
i) There are several methods commonly used for the formulation of fertiliser recommendations. These include:
- Critical leaf and/or soil nutrient level method
- Optimum nutrient ratio method
- Yield response function method and
- Nutrient balance method
ii) In actual practice, derivation of fertiliser rates does not rely exclusively on any one method. An integrated approach, which combines the above methods, is usually adopted and AAR is one of its proponents.
iii) Primarily, the nutrient balance method is employed first to compute the nutrient requirements of oil palm in a manuring block. This approach assumes that the oil palm agroecosystem has definite components of nutrient removal (demand) from the system and nutrient return (supply) to the system (Figure 1). The components of nutrient demand are:
- Growth
- Yield
- Nutrient losses through leaching, run-off and erosion
- Nutrient removed by pest damage and
- Nutrient non-availability and antagonisms.
The components of nutrient supply are:
- Nutrient returns from the palms, e.g. pruned fronds
- Nutrient returns from leguminous covers
- Rainfall
- Soil
- Fertilisers

The basic principle is then to estimate the total demand of the palm and match it with the nutrient supply by the oil palm agroecosystem excluding the fertiliser component. The shortfall between the nutrient demand and supply, which is also called gross nutrient requirements, should be met by fertilisers.
iv) A number of studies have been made to quantify the various components of nutrient demand and supply in the oil palm agroecosystem.
v) The two largest components of nutrient demand are Growth and Yield. They are also the first key steps in an effective fertiliser management scheme as outlined earlier. Thus, it is essential that the agronomist estimates the growth rate and yield trend of a manuring block right from the start. A typical example of the growth rate of oil palm using leaf area as the criterion is shown in Figure 2. Coupled with the leaf nutrient concentrations, the agronomist will be able to estimate the nutrient requirements necessary to attain the expected growth. Similarly, the yield profiles in different regions of Malaysia as illustrated in Figure 3 will provide a clue on the nutrient removal per year from the manuring block which should be replaced by fertiliser inputs.


vi) On the nutrient supply side, available data suggests that atmospheric returns are probably insignificant. However, pruned fronds can provide substantial nutrients to the palms to the tune of 36% for N and 27% for K on poor inland soils in Peninsular Malaysia. In mature oil palm areas, the last component of nutrient supply is soils. Unfortunately, most Malaysian soils including those from Sabah are inherently poor in nutrients particularly N and P (Table 1). Therefore, most of the nutrients required by the palms have to come from fertilisers, usually in mineral forms.
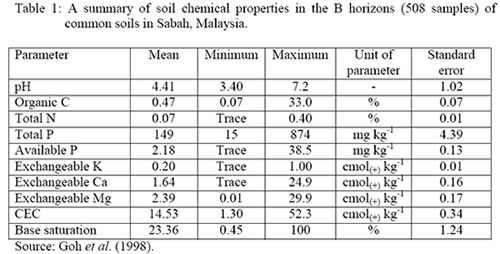
- An example of the computation of nutrient balance and fertiliser requirements to sustain 30 t/ha/yr in a mature oil palm field is shown in Table 2. It is assumed that the oil palm is in a steady state and grown on a soil with poor fertility. Under steady state condition, the canopy size remains constant and therefore, the nutrient requirements for canopy growth should be met by the nutrients recycled from the pruned fronds. The final analysis shows that the annual fertilisers needed for each palm to satisfy the gross nutrient requirements totalled 10.75 kg and comprise 4.22 kg Ammonium chloride, 0.97 kg Jordan phosphate rock, 3.59 kg Muriate of Potash and 1.97 kg Kieserite.

- While the nutrient balance approach provides the gross nutrient requirement, it does not work out the fertiliser requirements directly. We need information from fertiliser trials to enlighten us on the optimum fertiliser rates and the yield responses. In Sabah, the oil palms respond mainly to N fertiliser followed by K and P fertilisers (Table 3). The response to N generally exceeds 15 % except on Lumisir Family soil. The latter might be attributed to its high inherent soil fertility status as indicated by the yields in the control plots (no fertiliser). K responses are mainly lower than those experienced in Peninsular Malaysia. Again, this can be explained by the relatively high soil exchangeable K status as shown in Table 1. These results strongly imply that the agronomist must know and understand the soil properties in the manuring blocks, not just the soil names, to draw up proper and effective fertiliser recommendations to the estates.
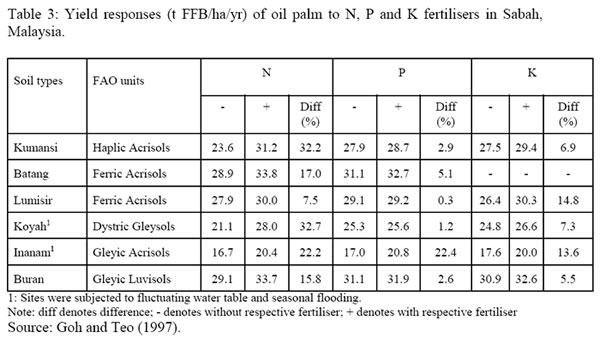
- We can also predict the fertiliser efficiency in each trial by plotting the gross nutrient requirements against the fertiliser rates as shown in Figure 4 while Table 4 shows the fertiliser efficiencies in some coastal and inland soils in Peninsular Malaysia. The highest K fertiliser efficiency was in Munchong series soil at 83%. This was due to the poor soil K reserve and good yield response to K fertilization. The lowest fertiliser K efficiency was found in Briah series soil at 19% due to high fertiliser rates and soil K status. In general, fertiliser efficiency is affected by the gross nutrient requirement, imbalanced nutrition, fertiliser rates, soil fertility and nutrient losses.
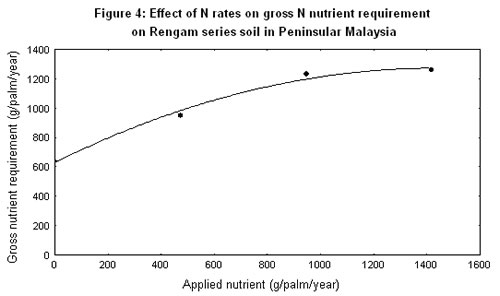

- Collating and assimilating the data from fertiliser trials conducted worldwide have enhanced the confidence of the agronomists to extrapolate the results to other sites with similar conditions and combining them with nutrient balance computation, leaf analysis and soil fertility status to produce the fertiliser recommendations.
- High fertiliser rates alone will not always provide optimum economic returns: a balanced fertiliser program is also essential as illustrated in Table 5. Nitrogen increased yield by 49% in the presence of high K rate. Similarly, there was a 25% yield response to K when high N rate was applied. Both N and K also had beneficial effect on the vegetative dry matter production.

- Apart from the above, application of K fertiliser will decrease oil to bunch ratio in the absence of N fertiliser (Table 6). However, with sufficient N level, K fertiliser generally increased the oil to bunch ratio to similar level compared to the control.

- Positive interactions of K fertiliser with other agronomic practices such as mulching, frequency of application and frond placement have been reported to increase yield between 4% and 14%.
- While capitalising on synergistic effects will improve yield and fertiliser efficiency, avoidance of antagonistic effects is also necessary to maximise fertiliser use. For example, high K rates have been shown to depress Mg and B uptakes and might decrease yield.
Potential nutrient losses and environmental concerns
The recommended fertilisers should be applied in a manner that they are absorbed by the palms at maximum efficiency. This is best done by minimising fertiliser losses in the plantation, which is even more important now in view of the current economic woes. It should also minimise environmental problems if any.
Nutrients may be lost by surface run-off, leaching through the soil profile, nutrients fixation, volatilisation and immobilisation by ground covers in young oil palm. An understanding of these nutrient loss mechanisms is essential to alleviate them and improve fertiliser efficiency.
i) Surface run-off
- On average 11% of N, 3% of P, 5% of K, 6% of Mg and 5% of Ca applied can be lost in surface run-off alone (Table 7). These results were obtained during a low rainfall year with only 1426 mm on a 9% slope. The most susceptible areas for run-off tend to occur in the harvester’s path and along the oil palm rows where the soils are more compacted and the ground vegetation is generally sparse.

- More recent data obtained by AAR also indicate that the mean run-off losses as percentage of the nutrient applied are within the following ranges: 5-8% N, 10-15% K, 4-6% Mg and less than 2 % for P (Table 8). These results show that soluble nutrients such as N, K and Mg are more susceptible to run-off losses. We further found that nutrient losses via surface run-off are highly dependent on the rainfall pattern at the time of fertiliser application, particularly during the first few rains after application and the antecedent moisture status of the soil. Other equally important factors, which might affect run-off, are the canopy cover, rainfall intensity and quantity, soil characteristics and slope.
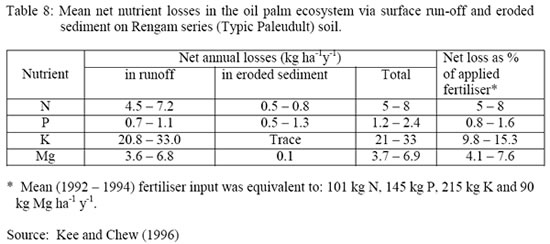
ii) Leaching losses
- Leaching losses during the first four years of oil palm growth (as % of total nutrient applied) have been found to be about 17% N, 10% K and 70% Mg. Losses are substantially reduced to about 3% N, 3% K and 12% Mg when the palms are fully matured (Table 9). The main reasons for the high leaching losses during the early stage of palm growth are probably poor palm canopy cover, less extensive root system and ground covers are generally not well established especially during the first year after planting.

iii) P Fixation
- Losses due to fixation by the soil involve mainly phosphate fertilisers. The P fixing capacities of some of the common Malaysian soils are shown in Table 10. The amount of P ‘fixed’ ranged from 208 mg to 1172 mg per kg soil and is related to its clay mineralogy. Although soils with high P fixing capacity improve P dissolution of phosphate rock, they also decrease the soil solution P (intensity), which is required for plant uptake. The general approach is to use less reactive phosphate rock and concentrated application of fertiliser through high rate and banding for these soils.

iv) Volatilisation losses
- Volatilisation losses are only significant when urea is surface applied, usually over the compacted weeded palm circles. High volatilisation losses in the oil palm field occurred at high rates of fertilization and on light texture soils as shown in Table 11.
- To increase the efficiency of urea, it should preferably be buried in the ground. However this practice is only suited to small-scale cultivation and unlikely to be practical and economical on a large plantation. Correct timing provides a more suitable means to improve the efficiency of applied urea. For example, volatilisation loss is reduced if urea is applied when moderate rains are expected so that the fertiliser may be washed into the soil.

v) Immobilisation by ground cover in young oil palm
- Weed growth is strongest in high light conditions in immature plantation. The young palms without extensive root systems are less able to compete for nutrients at this stage, which reduce their nutrient uptake and growth (Table 12). One point of interest is that the total N immobilised by the ground covers commonly exceeded run-off losses and immobilisation by young oil palms.
- With respect to interrow vegetation management, spraying out the competitive weeds in the interrow vegetation at immaturity and maturity on Selangor series soil (fertile soil) gave the highest oil palm yields after 4 and 6 ½ years respectively. On the other hand, over spraying could lead to bare ground conditions which might cause higher leaching losses, reduce soil moisture and result in poorer soil structure. This in turn may lower FFB yield.

Economics of fertiliser recommendations
- The plantation industry is a business proposition and as such, the economic value of a fertiliser is important. This is because the application of fertiliser necessarily increases the cost of production, which has to be at least offset by an increase in yield in order to be profitable.
- Owing to the delay in the effect of fertiliser on yield, the additional return from the increased yield may be realised in full only after 8 months or even a few years. Furthermore, the magnitude of yield response may vary considerably and the economic comparisons of fertilisers should be based on a discounted cash flow or a similar scheme over the specified period.
- An example of the economic computation of two sources of fertiliser is provided in Table 13. We choose kieserite versus ground magnesium limestone (GML) to illustrate the point that knowing the agronomic efficiency of a fertiliser as obtained from fertiliser trials is insufficient to recommend its application. Table 13 shows that the agronomic efficiency of GML based on substitution rate was only 74% as effective as kieserite. However, GML was only one-third the price of kieserite at the time of writing. This favoured GML with the consequent relative economic efficiency reaching 2.5. This meant that GML was 1.5 times more efficient compared to kieserite in economic terms.
- Using the above approach, an expensive fertiliser may be more economical to use if its agronomic efficiency far outweighs its price ratio compared to its competitors.
- Although the above computation is a standard in economics, of late there are counter arguments which suggest that the selection of a fertiliser should be based on its agronomic efficiency instead of economic efficiency. This contrasting proposition stems from the fact that commodity prices are usually unpredictable and therefore, the economic efficiency can vary substantially. Such view is probably a fallacy since decision-making processes in agriculture, like all businesses, are always done in the face of uncertainty, be it prices or weather etc. Moreover, the use of tender fertiliser prices will allay or negate part of the problems. In plantation agriculture, profit considerations are given the highest priority and therefore, the economic efficiency will always take the centre stage.
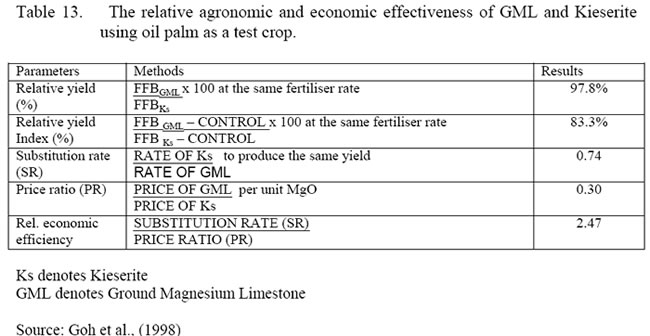
Additional agronomic principles for young palms
The strategy in young palms, apart from the above, should be:
- To minimise nutrient requirements by maximising returns from the biomass of the previous crops e.g. rubber, cocoa or oil palm by the shredding and no-burn techniques currently practised in many plantations.
- To promote growth of very good leguminous covers with high P and Mg applications and subsequent large nutrient return including N fixed.
Such an approach would reduce fertiliser requirements of the young palms substantially and improve growth and yields, thereby leading to extensive benefits all round.
Reference
Goh, K.J., Teo, C.B., Chew, P.S. and Chiu, S. B. (1999) Fertiliser management in oil palm: Agronomic principles and field practices. In: Fertiliser management for oil palm plantations, 20-21, September 1999, ISP North-east Branch, Sandakan, Malaysia: 44 pp
Note: The full list of references quoted in this article is available from the above paper.