Changes in Soil Properties: Results and Discussion
[addw2p name=”changesInSoilProperties”]
The changes, Δ, to pH, organic C, total N, total P, Bray-2 P, exchangeable K and exchangeable Mg were discussed from the following aspects:
-
Site: The different sites where sampling was carried out i.e. in IR and PC
-
Depth: Comparison of rates of change in soil nutrients between the two depths i.e. 0 – 15 cm and 15 – 45 cm
-
Initial value: The initial value, x 1
-
Time / period: The soil sampling data were grouped into 3 main periods i.e. 1982 and earlier (coinciding with burning as the main land clearing method), 1983 to 1994 (where partial burning was generally carried out) and post 1994 (where zero burning was the main land clearing method). The lag time for all 3 periods are not the same.
Site, Depth and Initial Value
Table 2 summarizes the sample size for the data used as well as the median initial value of each parameter for both sites (IR and PC) and depths (0 – 15 cm and 15 – 45 cm) while Table 3 summarizes the % change of each parameter.
Table 2 : Sample size and median initial value of each soil chemical property (parameter)
|
Parameter / Variable |
Median of initial value for each parameter at 2 sites and 2 depths |
|||||
|
Site |
Depth |
|||||
|
n* |
IR |
PC |
n* |
0-15 cm |
15-45 cm |
|
|
pH |
472 |
4.48 |
4.26 |
472 |
4.45 |
4.30 |
|
Organic C (%) |
– |
– |
– |
390 |
1.30 |
0.92 |
|
Total N (%) |
– |
– |
– |
390 |
0.120 |
0.090 |
|
Total P (mg/kg) |
320 |
146.5 |
216.0 |
320 |
212.5 |
151.1 |
|
Bray-2 P (mg/kg) |
520 |
11.6 |
35.8 |
520 |
27.7 |
15.5 |
|
Exch. K (cmol/kg) |
538 |
0.140 |
0.240 |
538 |
0.190 |
0.170 |
|
Exch. Mg (cmol/kg) |
478 |
0.200 |
0.220 |
478 |
0.240 |
0.179 |
|
Parameter / Variable
|
Median of % change for each parameter at 2 sites and 2 depths |
|||||
|
Site |
Depth |
|||||
|
IR |
P. Circle |
p-value |
0-15 cm |
15-45 cm |
p-value |
|
|
pH |
-3.20 |
-1.97 |
0.0097 ** |
-2.48 |
-2.60 |
0.0000 ** |
|
Organic C (%) |
– |
– |
– |
-9.69 |
-15.76 |
0.0001 ** |
|
Total N (%) |
– |
– |
– |
-6.72 |
-12.50 |
0.0001 ** |
|
Total P (mg/kg) |
0.8 |
-3.9 |
0.3575 ns |
1.9 |
-4.5 |
0.0000 ** |
|
Bray-2 P (mg/kg) |
16.0 |
-9.5 |
0.0000 ** |
6.7 |
-7.4 |
0.0000 ** |
|
Exch. K (cmol/kg) |
15.3 |
0 |
0.0031 ** |
5.1 |
7.6 |
0.6643 ns |
|
Exch. Mg (cmol/kg) |
-18.5 |
-3.3 |
0.1112 ns |
-5.9 |
-18.6 |
0.0022 ** |
Soil pH
Most crops grow best at a certain range of soil pH as soil acidity affects plant growth in many ways. However, the oil palm is tolerant to high acidity and is able to grow well under a broad range of soil pH (Goh and Chew, 1995a), from 4.0 to 5.5. Hyperacidity symptoms could be observed when soil pH is below 3.5 as the low pH is deleterious to normal root growth and function (Poon, 1983).
In general, there was a slight decline in soil pH of less than 3.2 % for both micro-sites and depths (Table 3). The declines in soil pH might be mainly attributed to nitrification process, which oxidizes NH4 + to NO3– and releasing H+ ions as follows:
![]()
Therefore, N sources from applied fertilizers, organic manure and legumes containing or forming NH4+ increases soil acidity.
The change in soil pH (Table 3) was more pronounced in the IR (pH lower by 3.2%) compared with the PC and this could have been attributed to the higher initial value of pH in the IR (Table 2), which was more susceptible to change due to the sigmoidal pH buffering curve. Moreover, the lower exchangeable bases in the IR (Table 2) would reduce its buffering capacity against the H+ produced from the nitrification process resulting in a larger decline in soil pH.
The lower initial value of pH in the PC (pH = 4.26) could be due to the prolonged concentrated application of N fertilizers in its limited space compared with the IR (Kee et al ., 1995). Most experimental evidence also supports the view that the electrical potential gradient maintained by the H+ efflux pump provides the driving force for active uptake of K+ across the plasma membrane (Haynes, 1990). Therefore, with more rooting activity for K uptake in the PC (Kee et al ., 1995), higher extrusion of H+ would occur resulting in low soil pH. The same would also be expected to occur to Ca2+ and Mg2+ uptake. The NO3– is also leachable to lower depths along with the basic ions of K+, Ca2+ and Mg2+. As these bases were removed and replaced by more H+, soils at lower depths (2nd depth of 15 – 45 cm) became slightly more acidic, which was evident from the results in Table 3.
This acidifying effect has also been reported in established oil palm plantations (Chew and Pushparajah, 1996), whereby fertilizer applications have been carried out as a routine. From our data, the magnitude of decline in pH also appeared to be larger with a longer lag time in sampling (Figures 2a and 2b) i.e. % drop in pH greater when the two samples were taken at longer interval. Kee et al . (1995) working on Musang series soil (Typic Paleudult) showed that the surface soil pH after 7 years of applying fertilizers at the highest rate within a circle of about 2 m radius around the palm base declined markedly to 3.8 compared with control plots of 4.2, a drop of almost 10% compared with the approximately 3% obtained via our data (extrapolated for 7 years from Figure 2b). All in all, the drop in pH although noted, was generally small and probably negligible to the oil palm, which is tolerant to such conditions.

Nevertheless, we should still take necessary measures to prevent soil pH from going lower as it is usually used as a criterion of land degradation. Some measures to minimize the reduction of soil pH include the following:
-
Broadcasting of fertilizers instead of applying them in a band or concentrating them only to the PC
-
Use of ammonium nitrate or urea will have lower acidifying effect. However, urea application should be restricted to clayey soils and properly timed to reduce volatilization losses whereas ammonium nitrate should be avoided in sandy soils due to its higher leaching potential
-
Application of alkaline fertilizers e.g. magnesium carbonate and empty fruit bunches
-
Maintain proper water-table over acid sulphate layers in acid sulphate soils to prevent or reduce the oxidation of sulphite that results in sulphuric acid build-up
Soil Organic Carbon
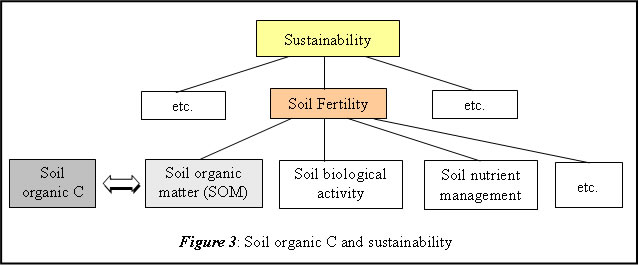
Managing the soil organic carbon (organic C) would go hand in hand with the management of soil organic matter (SOM) and in oil palm plantations, soil fertility is mainly determined by the management of SOM including soil biological activity, soil nutrient management etc. Soil fertility management on the other hand is a keystone of sustainable agriculture. As the oil palm plantations have many sources of SOM, most of them are produced daily by the living oil palm itself such as pruned fronds, male inflorescences, shed leaf bases and roots as well as palm bio-products of empty fruit bunches (EFB), palm oil mill effluent (POME), decanter sludge, shell and fibre, natural vegetation and legumes, efficient management of SOM and the soil organic C would then ensure soil fertility, hence sustainability (Figure 3).
Soil organic C decreased at both depths (0-15 cm and 15-45 cm) with the lower depth dropping at a greater magnitude of 15.76% (Table 3). Although this decrease in soil organic C was substantial, it was localized and may not represent a decline in organic carbon on an agro-ecosystem basis as exemplified by a simplified oil palm “Carbon Cycle” (Table 4). The carbon supply from the oil palm ecosystem was computed from data of pruned fronds only without considering the following where data are unavailable:
- How much is lost as CO2
- How much is the net return from other palm organic sources e.g. palm bio-products (EFB, POME etc.), male inflorescence, frond buds and root turnover
- How much is the contribution of ground vegetation
Table 4 : Simplified oil palm “Carbon Cycle”
|
Particulars
|
Value |
|||
|
Carbon supply from Palm
|
Dry weight of pruned fronds (t/ha/yr) 1 |
8.5 |
||
| Total Carbon content from pruned fronds(kg/ha/yr) assuming 50% carbon content of dry weight |
4250 |
|||
|
Carbon loss from soil
|
Depth |
|||
|
0 – 15 cm |
15 – 45 cm |
|||
| Initial value of organic C (%) from Table 2 |
1.30 |
0.92 |
||
| % Change (from Table 3) |
9.69 |
15.76 |
||
| % Loss |
0.12597 |
0.14499 |
||
| Total weight of soil (kg), assuming soil bulk density of 1.1 and 1.25 g cm-3respectively |
1,650,000 |
3,750,000 |
||
| Organic C loss from soil (kg) |
2,076 |
5,437 |
||
| Organic C loss from soil (kg/ha) assuming IR makes up 51% of surface area |
1,060 |
2,773 |
||
| Total organic C loss from soil (kg/ha) for both depths |
3833 |
|||
| Total organic C loss from soil (kg/ha/yr) for both depths with weighted age of 5.4 years2 |
710 |
|||
Source 1: Henson (1999)
Note 2: Weighted age from data of Table 3
The 9.7 % and 15.8% reduction in organic C resulted in a total of 710 kg/ha/yr loss in organic C. Nevertheless, annually more than 4000 kg/ha (Table 4) of carbon can be potentially replenished by the palm’s pruned fronds alone. However, no data is currently available to determine the conversion efficiency of pruned fronds to organic C in oil palm agro-ecosystem in the long-term.
Chew and Pushparajah (1996) reported that organic C increase was not noted in oil palms due mainly to the uneven redistribution of recycled fronds, which could also explain the reduction of organic C obtained by our data set. In general, the IR, where soil sampling is carried out are kept relatively free of pruned fronds and hence no addition of organic matter to this micro-site would occur except from the low density of light vegetation kept by cultural practices, if any. Therefore, the practice of stacking pruned fronds in neat, narrow rows should probably be changed to wider placement covering as much of the IR as possible in view of the above. Establishing vigorous shade tolerant perennial leguminous cover crops such as Mucuna bracteata may offer another option to build up the SOM.
Total N
The Ultisols in Johor have low total N contents with a median value of 0.12 % in the top soil and 0.09 % in the lower depth (Table 2). Total N decreased in both soil depths in tandem with their soil organic C. This implies that most of the total N in the soils is in the organic form. The declines in total N contents contradicted the work of Chew and Pushparajah (1996) and Ling et al . (1979) who reported a lack of changes in soil N under oil palm cultivation.
The drop in total N in the first soil depth was not as accentuated as the second depth (Table 3). This might be ascribed to the higher rooting activity and root turn-over of oil palm in the upper soil depth, which may contribute substantially to the organic C balance (Henson, 1999). Similarly, the higher biological activity of the topsoil and potential addition of organic matter from the oil palm such as pruned fronds, EFB and POME, and the leguminous cover crops during the palm’s immaturity phase might have mitigated the decrease in soil organic C in the first depth and therefore, total N content also compared with the lower depth (Table 3). Nonetheless, the approaches to enhance SOM as suggested earlier are also appropriate to sustain total N content of the soils.
Total and Bray-2 P
The Ultisols in Johor were also generally marginal in P status (Table 2). Phosphate rocks have been used to supplement the P requirement of the oil palm and positive P responses have been obtained (Goh and Chew, 1995b). Despite the regular applications of phosphate rocks in the oil palm estates, total P and Bray-2 P posted increases in the IR only with slight declines in the PC (Table 3). This might be attributed to the policy of applying phosphate rocks in the interrow of mature palms and onto the legumes in immature palms. These results were agreeable with Hartemink (2003) who detected much higher soil P levels in soils under perennial crops compared with natural forest and Ling et al . (1979) who found a build-up of P even when the fields were burned for planting.
The higher increase in Bray-2 P compared with total P following phosphate rock applications corresponded well to the findings of Zaharah (1979). Bray 2-P extracted substantial amount of phosphate rocks apart from the dissolved P, which accentuated the P increase in particular when the initial P values were low (Table 2).
Build-up of both total and Bray-2P was also noted in the upper layer due to surface applications of P fertilizers, the low dissolution of phosphate rocks and slow migration of dissolved P into the lower soil depth due to P fixation or adsorption by sesquioxide. Thus, most of the dissolved P accumulated in the top 30 cm of tropical soils (Zaharah, 1979).
Exchangeable Kand Mg
Most Ultisols also have low exchangeable cations of K and Mg and those in Johor are no exception (Table 2). Even if complete recycling of EFB and POME produced from the FFB yield is to be carried out, the nutrients required by the palms for high yield levels are still higher than the nutrient supply from the oil palm agro-ecosystem (Ng et al ., 1999). Therefore, they need to be augmented by inorganic fertilizers to maintain the yield levels.
This resulted in positive changes to exchangeable K in the IR and both soil depths (Table 3). Slight increase in exchangeable K was also reported by Ling et al . (1979) when improvement in the legume coverage was obtained. Kee et al ., (1995) also noted a four-fold increase in exchangeable K, which were evident to a depth of 60 cm. The build-up of exchangeable K in the IR compared with the PC (Table 3) could be due to the applications of K fertilizers in the former micro-site for mature palms in particular with the wider use of fertilizer spreaders. In addition, pruned fronds and EFB, both containing high amounts of K are also normally applied in the IR.
Exchangeable Mg was noted to decrease for both micro-sites and depths (Table 3) due mainly to the generally high rates of NH4+ fertilizer and KCl fertilizer used, which were known to cause the soil Mg to leach down due to the ionic exchange between the above cations at the soil complex. The magnitude of drop in exchangeable Mg in the PC although not statistically significant, was lower compared with the IR. This might be ascribed to the practice of applying Mg fertilizer, Kieserite, in the former micro-site. The negative soil Mg balance should be arrested with closer monitoring of the soil Mg status and the applications of ground magnesium limestone and/or kieserite where appropriate.
Time / Period
The data were also summarized to coincide approximately with the 3 different practices of land preparation for oil palm planting i.e. burning, which was generally the case in 1982 and earlier, partial burning (1983 to 1993) and the zero burn technique (McCulloch, 1982; Hashim et al ., 1993) which is the most common method from 1994 onwards. We shall discuss the two extreme periods only i.e. the burnt and zero burnt to avoid complication in the interpretation since the partial burnt period might include some fields that were fully burnt or zero burnt.
Burning of the organic palm biomass at replanting had little effect on the long-term soil pH (Table 5) although short-term increase in soil pH had been reported (Ling et al ., 1979), which was attributed to the addition of exchangeable bases in the ash. These two results probably indicated that the ash effect on soil pH was temporary and easily nullified by the applications of acidifying fertilizers to the palms.
With the zero burn technique, soil organic C improved in the IR and in both depths (Table 5). Sly and Tinker (1962) also concurred that slight depression of organic C would be obtained if burning was carried out during land clearing. Similarly, Ling et al . (1979) reported reduction of soil organic C by burning in a jungle clearing although slight increase in the topsoil organic C was noted twelve months after the land clearing. Khalidet al . (2000) also found that different replanting policies of partial burning, stacking and pulverizing resulted in varied increases in soil organic C with the latter two methods yielding the highest increases.
Table 5 : % change for each soil chemical property (parameter) based on median for different periods
|
Parameter / Variable
|
Median change (%) of each parameter at 2 sites and 2 depths during burnt, partial burnt and zero burnt period |
||||
|
Site |
Depth |
||||
|
IR |
P. Circle |
0-15 cm |
15-45 cm |
||
|
pH
|
Burnt |
-3.49 |
-2.35 |
-2.41 |
-3.21 |
|
Partial Burnt |
-3.63 |
-1.04 |
-1.61 |
-2.49 |
|
|
Zero Burnt |
-1.75 |
-2.24 |
-2.95 |
-1.59 |
|
|
Organic C (%)
|
Burnt |
-9.63 |
– |
-5.49 |
-11.67 |
|
Partial Burnt |
-18.97 |
– |
-12.43 |
-24.57 |
|
|
Zero Burnt |
7.77 |
– |
1.87 |
15.56 |
|
|
Total N (%)
|
Burnt |
-2.38 |
– |
-1.63 |
-3.88 |
|
Partial Burnt |
-14.31 |
– |
-8.08 |
-19.35 |
|
|
Zero Burnt |
7.03 |
– |
0.00 |
14.29 |
|
|
Total P (mg/kg)
|
Burnt |
-14.37 |
-6.72 |
-6.10 |
-16.94 |
|
Partial Burnt |
9.37 |
0.00 |
17.88 |
-3.28 |
|
|
Zero Burnt |
31.04 |
-4.26 |
-12.47 |
7.80 |
|
|
Bray-2 P (mg/kg)
|
Burnt |
-4.37 |
-20.82 |
-3.45 |
-17.71 |
|
Partial Burnt |
30.07 |
-1.67 |
20.27 |
-2.30 |
|
|
Zero Burnt |
38.42 |
0.89 |
12.00 |
72.04 |
|
|
Exch. K (cmol/kg)
|
Burnt |
18.99 |
0.00 |
9.72 |
13.25 |
|
Partial Burnt |
8.33 |
-5.90 |
0.00 |
-2.94 |
|
|
Zero Burnt |
1.09 |
27.71 |
5.89 |
9.17 |
|
|
Exch. Mg (cmol/kg)
|
Burnt |
-23.30 |
8.25 |
0.00 |
-16.25 |
|
Partial Burnt |
-26.12 |
-30.71 |
-26.42 |
-31.58 |
|
|
Zero Burnt |
58.46 |
22.79 |
23.33 |
58.46 |
|
In general all the major soil nutrients of total N, total P, Bray-2 P and exchangeable Mg improved during the zero burnt period. Soil exchangeable K on the other hand appeared to yield better results when burning was carried out. This was agreeable with the observations made by Sly and Tinker (1962) that burning depressed nitrogen and decreased soil magnesium and calcium but gave larger exchangeable K. The increase in total N during the zero burnt period corresponded with the build up in soil organic C, which implied a large return of N from the previous palm biomass. On the other hand, the large positive changes in Bray 2-P and exchangeable K in the PC could be attributed to the increased P and K fertilizer rates to the palms following the higher yield responses to these nutrients (Goh et al ., 2000). The build-up of soil exchangeable Mg with zero burnt replanting technique will require further work to ascertain.
Extreme Soil Nutrient Changes
Although the median values of soil nutrient changes in the Ultisols under oil palm in Johor were favourable in the light of sustainability, land degradation and the environment, there were extreme values for all the soil chemical properties (Appendices 1c and 1d). These extreme values could be outliers due to sampling or analytical errors but nevertheless it is still prudent to scrutinize them because excessive soil nutrient depletion (negative values) and build-up (positive values) are both detrimental to the oil palm agro-ecosystem. Long-term nutrient depletion is known to cause yield declines in many agricultural crops (Hartemink, 2003) whereas excessive build-up of N and P can cause ground water pollution and eutrophication, respectively. In general, the data showed that build-up of soil nutrients was dominant compared with soil nutrient depletion in the Ultisols under oil palm in Johor (Appendices 1 c and 1 d).